
Fig. 4.
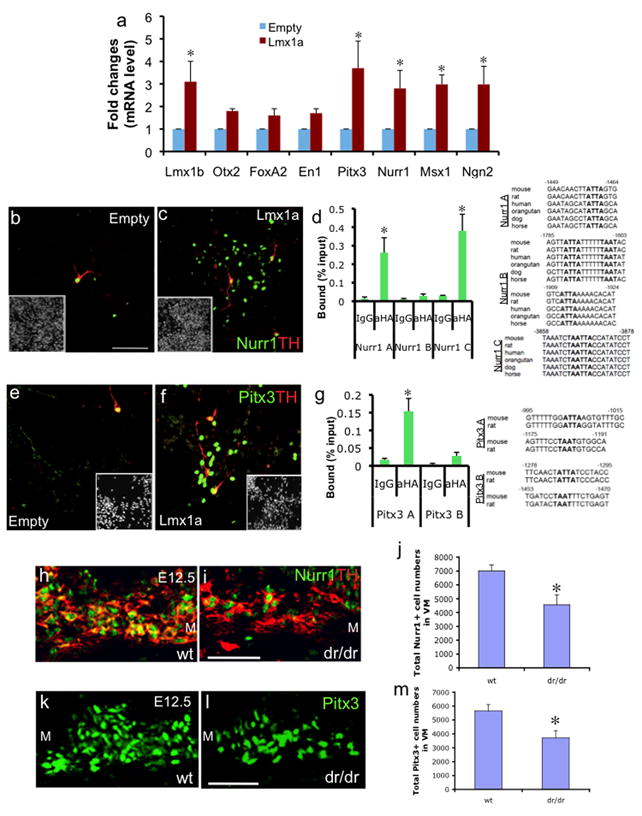
Lmx1a directly regulates Nurr1 and Pitx3. a. qPCR analysis on in vitro differentiated ES cells with empty or Lmx1a-expressing retrovirus (ND3; n=4, p<0.05). b–c. Immunocytochemistry on the same cells. Scale bar represents 50μm. d. ChIP-qPCR analysis on Nurr1 promoter region (n=3, p<0.05), performed as described above. e–f. Immunocytochemistry on the same cells. g. ChIP-qPCR analysis on Pitx3 promoter region (n=3, p<0.05), performed as described above. h–i. Immunohistochemistry analysis of VM in E12.5 littermates’ wt and dr/dr embryos using anti-Nurr1 and anti-TH antibody. M denotes medial VM. Scale bar represents 50μm. j. Cell counting analysis of Nurr1+ cells in ventral midbrain of E12.5 littermates’ wt and dr/dr embryos (n=4, p<0.05). Cell numbers were counted from every 6th sections using the StereoInvestigator image capture equipment and software. The estimated total cell numbers based on counting every 6th section are shown. k–l. Immunohistochemistry analysis of ventral midbrain in E12.5 littermates wt and dr/dr embryos using anti-Pitx3 antibody. m. Cell counting analysis of Pitx3+ cell numbers as described above (n=4, p<0.05).