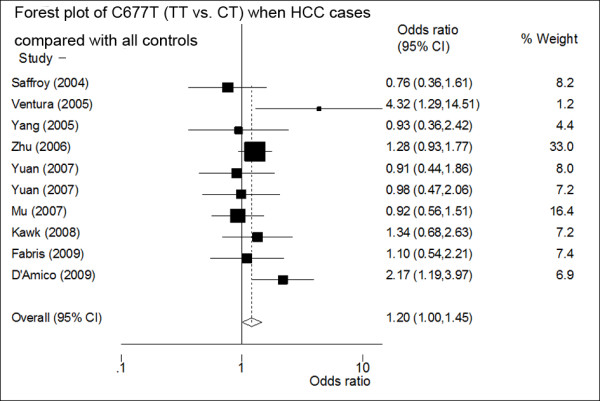
Figure 1.

Forest plot of the odds ratios (ORs) and 95% confidence intervals (CIs) of studies on the association between HCC and the MTHFR C677T polymorphism (TT vs. CT) of ten studies (including all controls). On the left, the first author of the study is followed by the publication year in parentheses. The size of the black box corresponding to each study is proportional to the sample size. The horizontal line shows the corresponding 95%CI of the OR. The combined estimate is based on a fixed-effects model shown by the diamond. The solid vertical line represents the null result.
