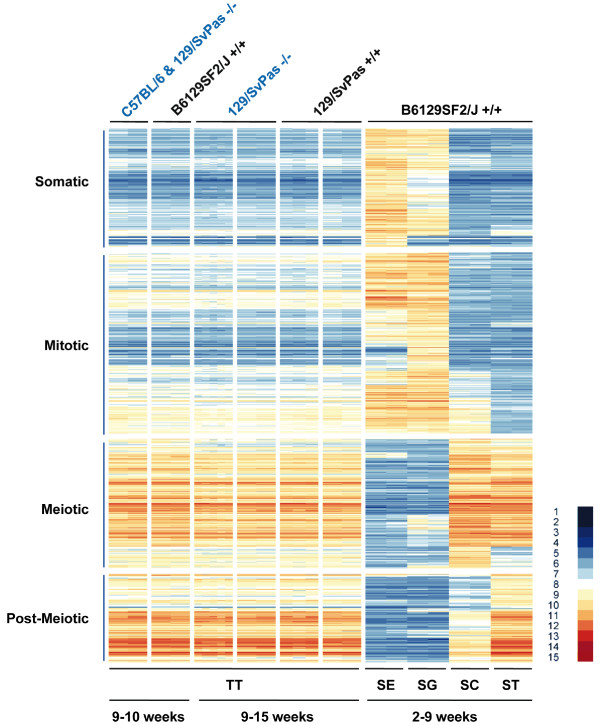
Figure 3.
The pattern of genes Differentially Expressed in Testis (DET) in FHL5 wild-type versus mutant samples. The DET group was identified in [14]. A heat map is shown that displays the expression signals in testis in the presence and absence of FHL5 for genes showing peak expression in Sertoli cells (Somatic), spermatogonia (Mitotic), spermatocytes (Meiotic) and spermatids (Post-Meiotic). Samples and scale are as in Figure 2.

