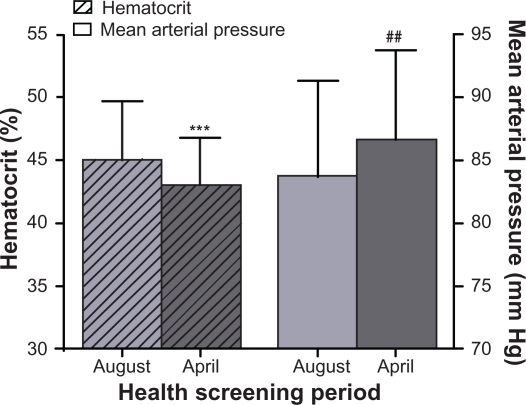
Figure 1.
Variation in hematocrit and mean arterial pressure due to seasonal differences between August and April, of the mixed male and female adult population in Kinshasa, Democratic Republic of Congo.
Notes: Data are presented as mean ± standard deviation. ***P ≤ 0.001 vs August hematocrit. ##, P < 0.01 vs August mean arterial pressure.

