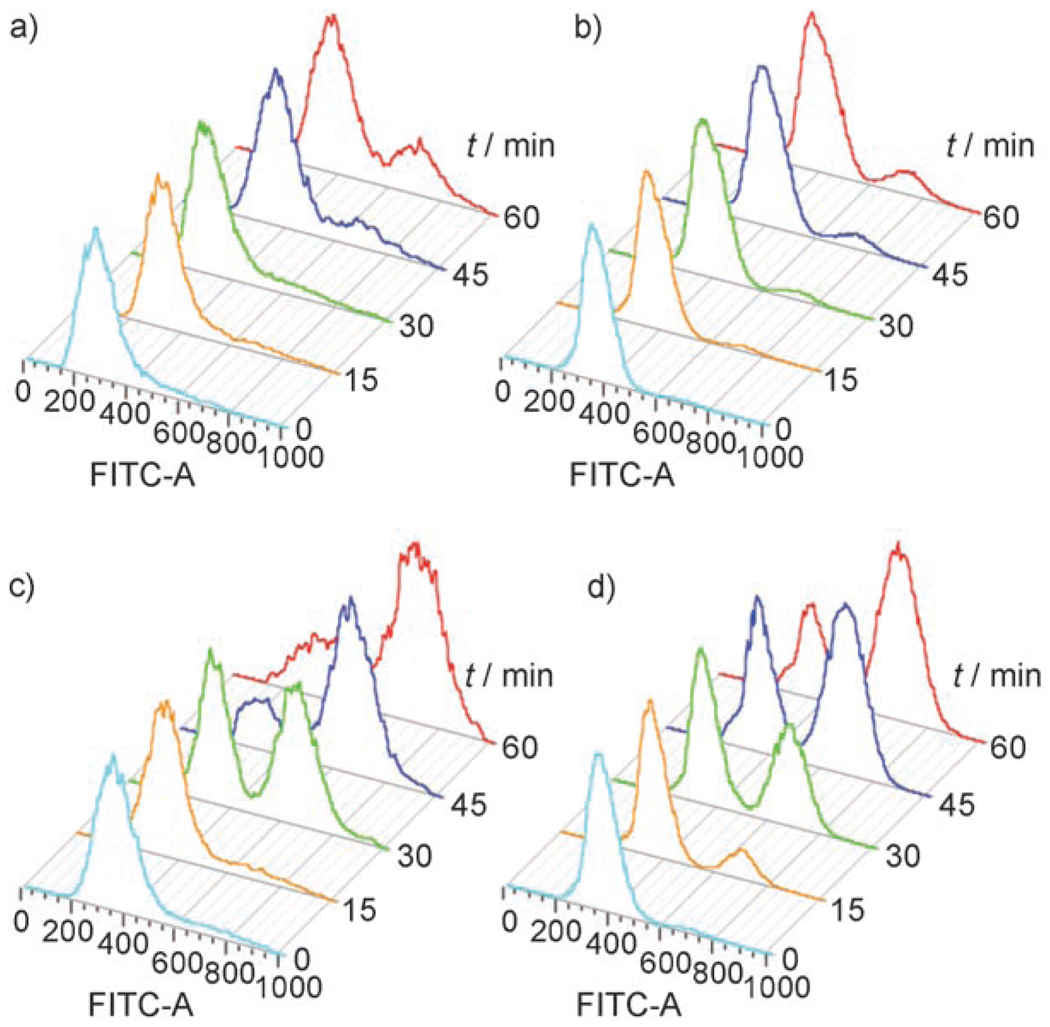
Figure 2.
Flow cytometry analysis of the release from G1 arrest by a G1/G2 trap assay. The DNA content was determined as 1N (G1 trapped) or 2N (G2 trapped; SYTOX green staining). a) 1, no release; b) 2a, no release; c) 1, washout; d) 2a, UV (5 min, 366 nm, 20 mWcm−2). FTIC-A=absorption of SYTOX green (fluorescein-based DNA stain).

