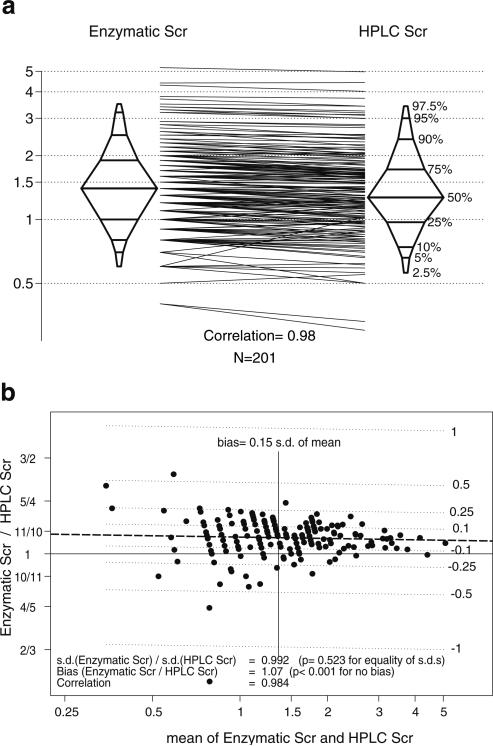
Fig. 1.
Comparison of Siemens Advia enzymatic assay against high-performance liquid chromatography (HPLC) using sera from the Chronic Kidney Disease in Children (CKiD) subjects. a Histogram of results and comparison of each determination showing a correlation of 0.98. The y axis is in milligrams per deciliter (mg/dl) presented in log scale. b Bland-Altman plot showing mean of Advia and HPLC values on the x axis and ratio on the y axis (difference of logs), with a bias of 7% overestimation by the Advia enzymatic assay. The scatter clearly appears larger at low serum creatinine values

