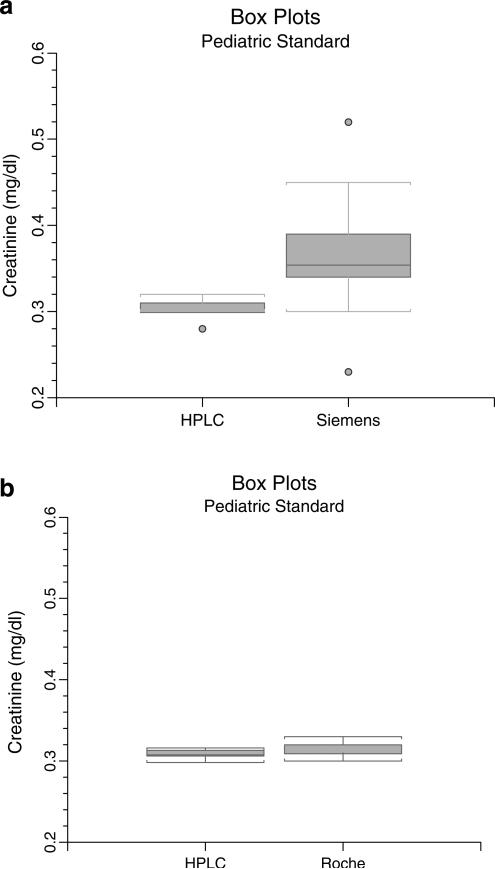
Fig. 4.
Box plots of multiple analyses (20) of diluted pediatric standard by enzymatic and high-performance liquid chromatography (HPLC) assays. The rectangle describes the interquartile range (IQR, 25th and 75th percentiles) and any horizontal line through the rectangle denotes the median. The horizontal portion of the “T” depicts upper and lower adjacent values, respectively, defined as the largest observation that is ≤75th percentile + 1.5 × IQR and the smallest observation that is ≥25th percentile minus 1.5 × IQR. Points above or below the upper and lower adjacent values are outliers. a Box plot of HPLC against Siemens Advia showing that the Siemens assay has a positive bias of 19% and a much larger range of values compared with HPLC. The CV of HPLC was 2% compared with 16% of the Advia. b Box plot of HPLC against the Roche enzymatic analyzer showing close agreement and narrow interquartile ranges. The CVs were 1.6% for HPLC and 2.3% for the Roche

