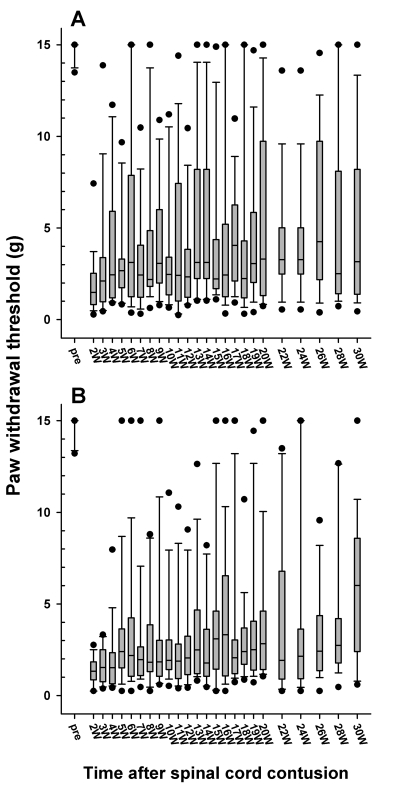
Fig. 5.
Follow-up of the paw withdrawal thresholds to mechanical stimulation in the 6.25 (A) and 12.5 mm (B) injury groups, which are expressed as a box plot. The data are expressed as a box plots with median (horizontal bar) and percentile points (25~75%; box) and 10~90% (error bar). The time after the spinal cord contusion indicates weeks (W) following the spinal contusion, except for "pre", which represents the preoperative test period.

