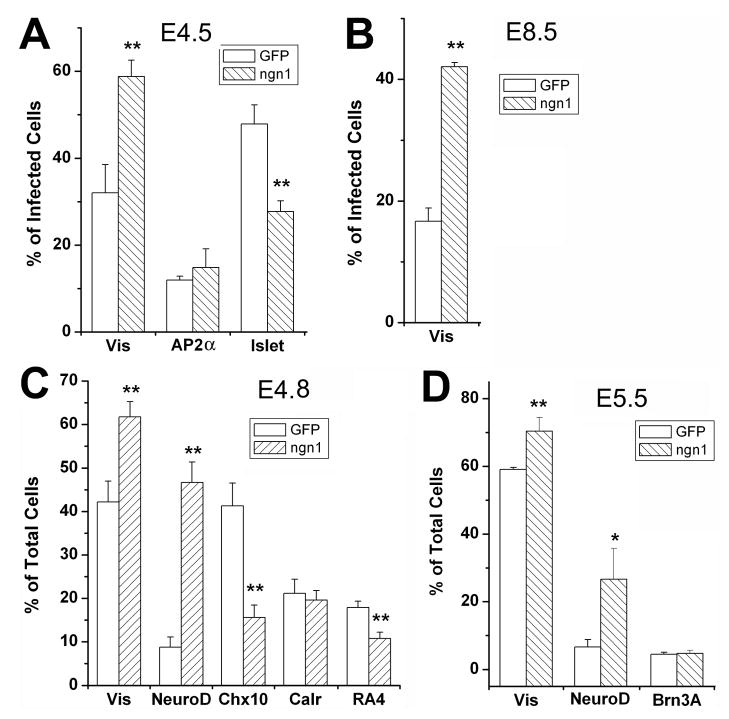
Fig. 7.
Quantitative analysis of alterations in retinal neurogenesis from ngn1 overexpression in dissociated retinal cells. Shown are the means ± SDs of the calculated percentage of cells identified with each marker. Statistically significant differences from the control are shown at the 0.05 (*) and at 0.01 (**) levels.

