
Figure 4. NESs and NLSs of p68.
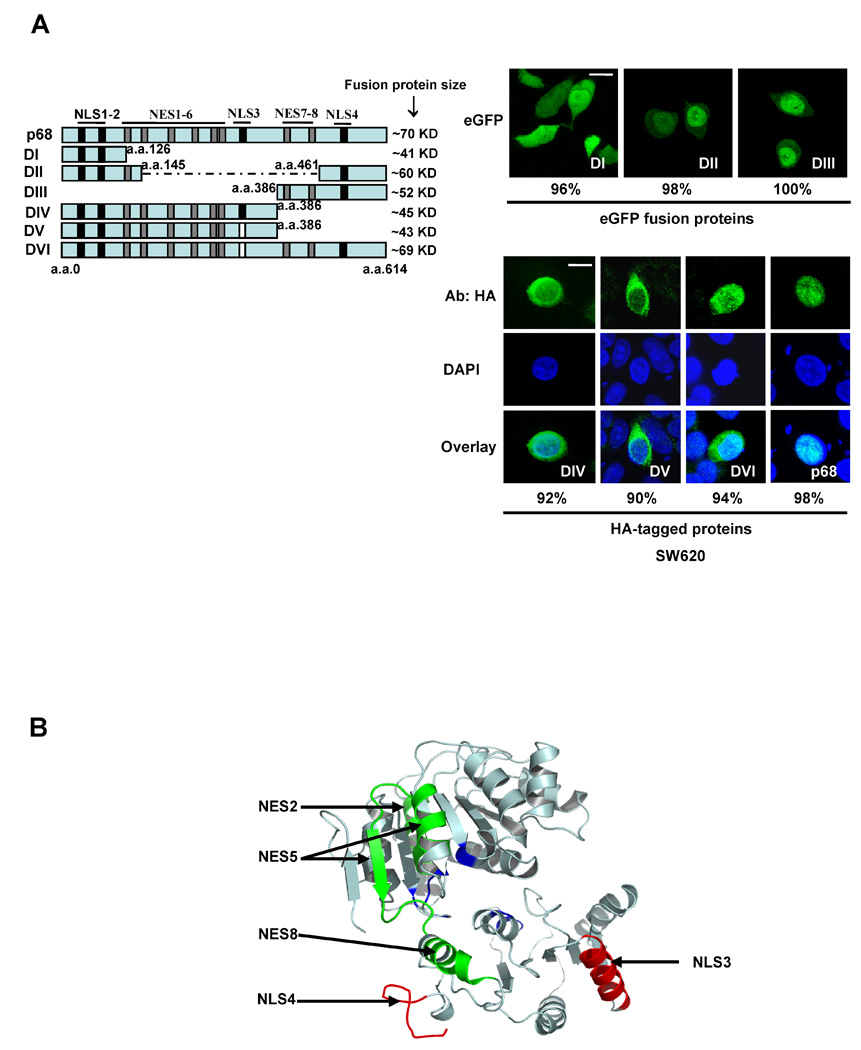
(A) P68 truncates (illustrated in the left panel) containing different putative NLSs and NESs either fusion C-terminal flank eGFP or N-terminal HA-tag were expressed in SW620 cells. The numbers indicate the molecular weight of each fusion protein. The black bars indicate the location of NLSs. The gray bars indicate NESs. The white bars indicate that the corresponding NLSs were deleted. (right panel) Examples of confocal fluorescent microscopy images show the localizations of eGFP fused (up) or HA-tagged p68 truncates (down) in SW620 cells. The HA-tagged p68 truncates in SW620 cells were immunostained with anti-HA antibody (Green). The blue is DAPI stain of the cell nucleus and overlay of anti-HA and DAPI stains. The numbers are percentage of cells showing similar localization pattern in a random group of 50 cells. (B) Model structure of p68 RNA helicase core domain. The model structure was constructed based on the X-ray crystal structure of another DEAD box RNA helicase drosophila vasa. The positions of NLS3 and NLS4, NES2, NES5, and NES8 are indicated by arrows.