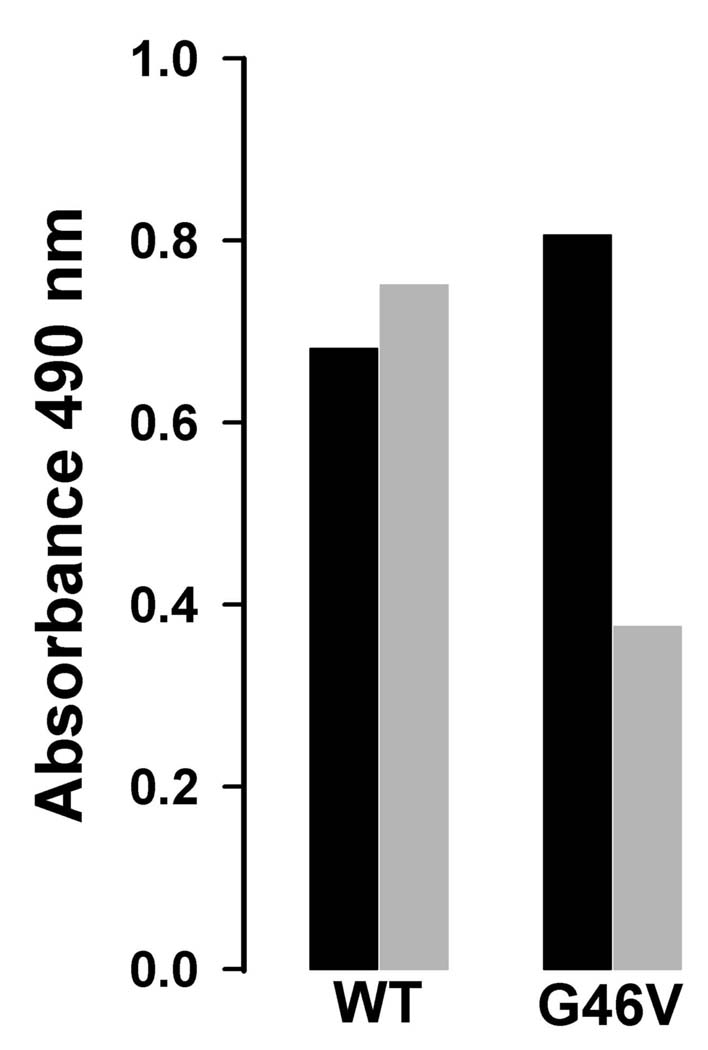
FIGURE 5.
Expression of CX50G46V protein decreased cell viability/survival. Graph represents the cell viability of HeLa-CX50ind (WT) and HeLa-CX50G46Vind (G46V) that were left untreated (black bars) or that were treated with 1 µM ponasterone A (gray bars) for 72 h. Cell viability was determined using the MTS assay in which the absorbance at 490 nm is proportional to the number of viable cells.

