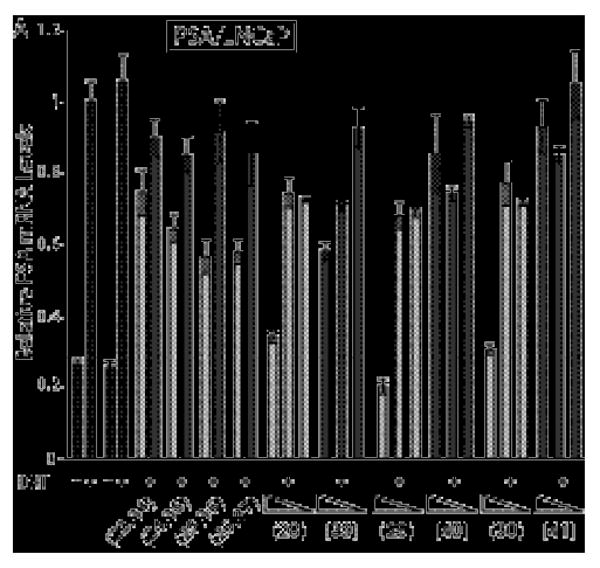
Figure 4.

Quantitative real-time RT-PCR data measuring the effect on relative PSA mRNA expression levels under DHT induction in LNCaP cells dosed with compounds 23-26, 28-30 and their mismatch congeners 34-37 and 39-41. Induced and uniduced control conditions are indicated by black bars, match core compounds by light grey bars, and mismatch core compounds by dark grey bars. Uninduced and induced control compounds without DMSO are on the left, and with 0.1% DMSO on the right. Errors shown are the fractional standard deviation. Cells were treated with match core control compounds 23-26 and mismatch core control compounds 34-37 as cell media solutions 5 μM in polyamide. Cells were treated with match compounds 28-30 and respective mismatch compounds 39-41 as 5, 1, and 0.1 μM solutions in cell culture media.
