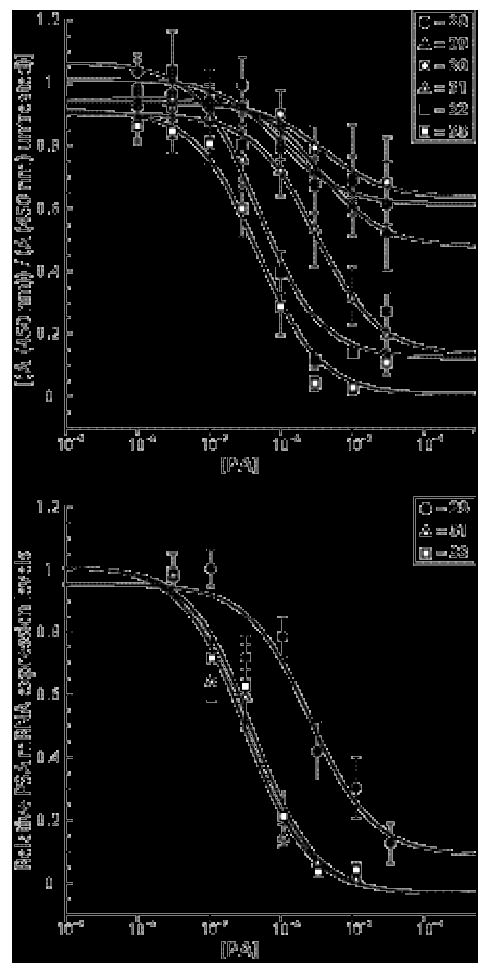
Figure 6.

Cell viability data and IC50 values for gene regulation for in LNCaP cell culture. A) Cell viability was measured by a WST-1 colorimetric assay for LNCaP cells dosed for 48 hours with polyamides 28-33 at the following concentrations: 30, 10, 3, 1, 0.3, 0.1, 0.03 and 0.01 μM. For 31-33, IC50 values for cell viability were extracted from isotherms generated in KaleidaGraph from the data. B) Quantitative real-time RT-PCR data for 28, 31 and 33 in LNCaP cells to establish IC50 values for PSA gene regulation under inducing conditions. Concentrations employed of 28 were 30, 10, 3, 1, 0.3 and 0.1 μM, and of 31 and 33 were 10, 3, 1, 0.3, 0.1 and 0.03 μM. IC50 values were extracted from isotherms generated in Kaleidagraph from the RT-PCR titrations. C) IC50 values (μM) for cell viability estimated or calculated for 28-33 and IC50 values (μM) for PSA gene regulation for 28, 31 and 33 shown in tabular format. Values given are average values of three independent experiments; the standard error of the mean is given in parentheses.
