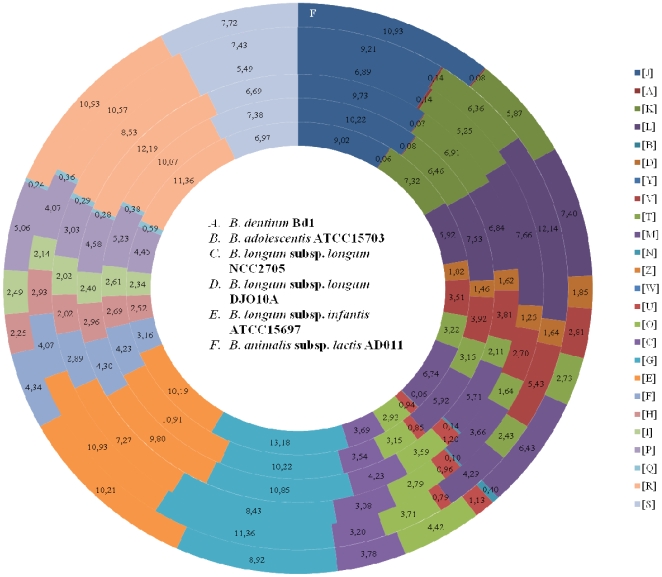
Figure 2. Comparison of COG functional categories between completely sequenced bifidobacterial genomes.
Each coloured segment indicates the relative contribution of a functional category as a percentage of total COGs. Each ring indicates a different bifidobacterial genome as labelled. The color of each COG family is indicated in the Figure The name of the bacterial genomes are indicated in the Figure.

