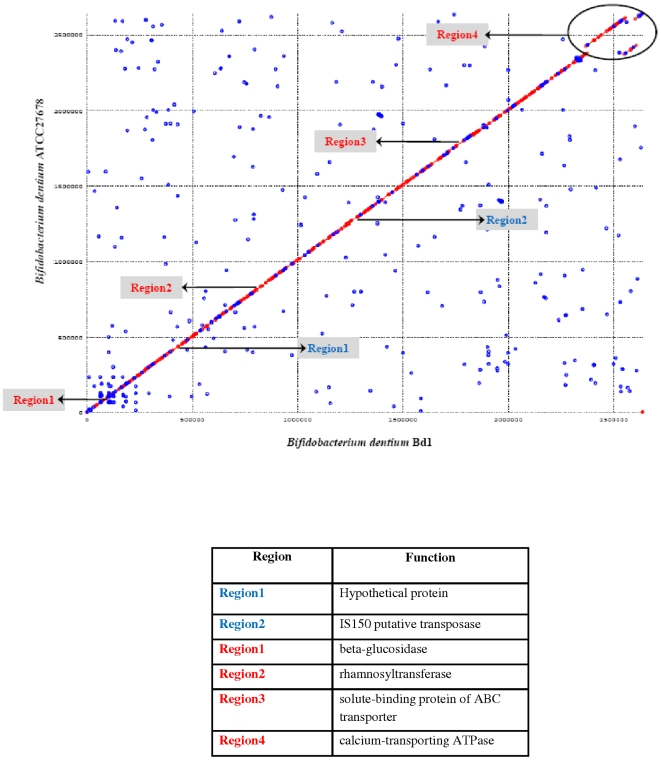
Figure 4. Dot plot of B. dentium Bd1 versus B. dentium ATCC27678.
The visible areas of divergence are indicated. Blue type indicates sequences unique to Bd1 compared with ATCC27678, whereas red type shown sequences absent in Bd1. The deduced functions of the divergent regions are described in the table.

