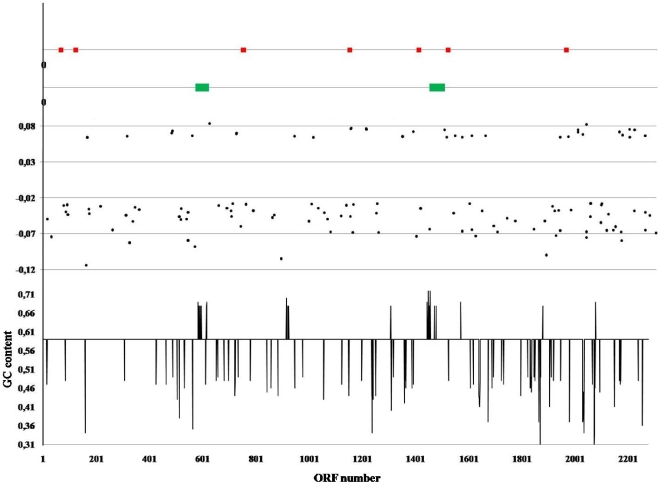
Figure 5. Mobile genetic elements of the B. dentium Bd1 genome.
IS elements and predicted prophage-like elements are labelled in red and green, respectively. The first plot from the bottom indicates the deviation of the G+C content of each ORF of the B. dentium Bd1 genome from the mean average (58.54%). In the second plot each dot represents an ORF displaying a biased codon usage determined by factorial correspondence analysis of codon usage.

