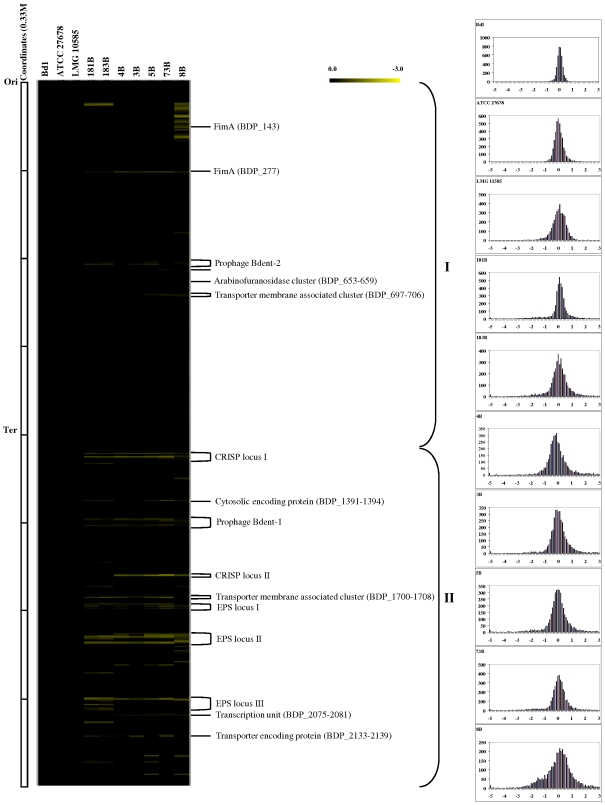
Figure 6. Genomic diversity in the B. dentium species with reference to the B. dentium strain Bd1 genome (Left) CGH data.
Each horizontal row corresponds to a probe on the array, and genes are ordered vertically according to their position on the Bd1 genome. The columns represent the analysed strains, and strains are identified by their code numbers. The colour code corresponding to the presence/absence is given at the top right of the figure: the gradient goes from black to green to indicate the presence, divergence or absence of a gene sequence. The predicted function of some relevant genes are shown on the right-hand margin, ori: origin of replication; ter, terminus of replication (left-hand inset). Right-hand inset displays Signal ratio distribution of the CGH data. The reference is B. dentium strain Bd1. Ratios are expressed in a log2 scale. See text for details.

