
Figure 5.
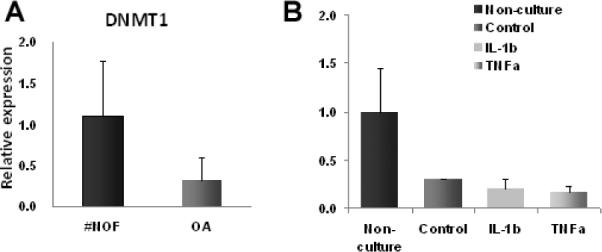
Expression of DNMT1 in articular chondrocytes in vivo (A) and in vitro (B). DNMT1 expression was less than half in OA chondrocytes compared with control (#NOF) chondrocytes (P<0.05). In vitro, culture alone had the greatest effect (P< 0.01) and the decrease in expression was of a similar in magnitude to the decrease in OA. In addition, TNF-α/OSM decreased expression further (P< 0.01). Means and SDs of n=5 for all groups.