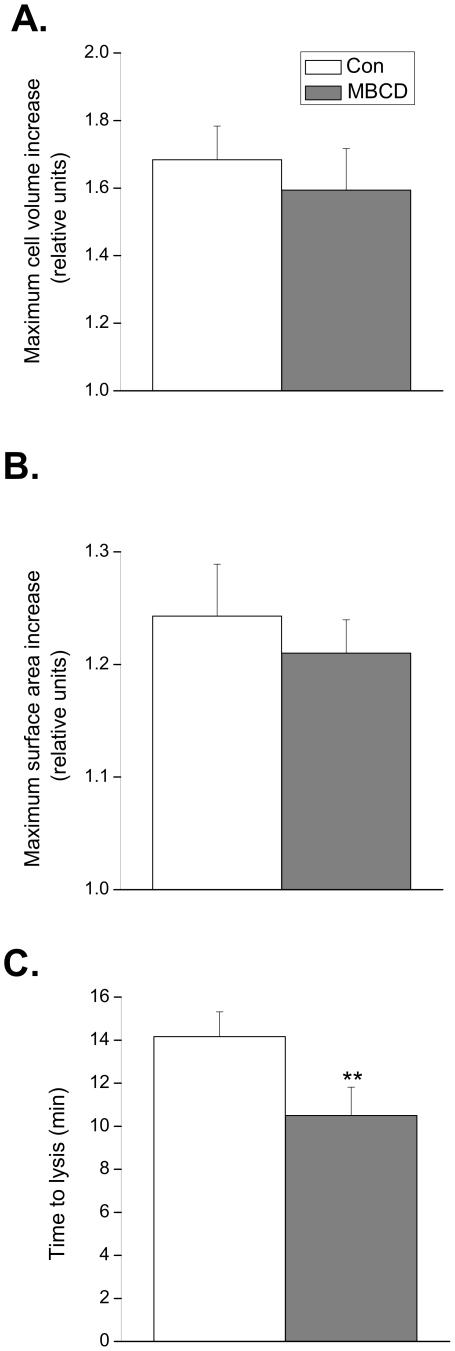
Figure 5. Effect of caveolar disruption on maximum cell volume, surface area and time to lysis in 5 mOsM solution.
Quiescent ventricular myocytes were exposed to a 0.02T hypotonic solution and the maximum cell volume and surface area achieved before lysis was estimated from a video image of the cell. Disruption of caveolae with MBCD did not significantly alter the maximum cell volume (A.) or surface area (B.) prior to lysis. C. The time to lysis was significantly reduced in cells treated with MBCD (** P<0.01 versus control; Student's t-test; n = 11 cells).

