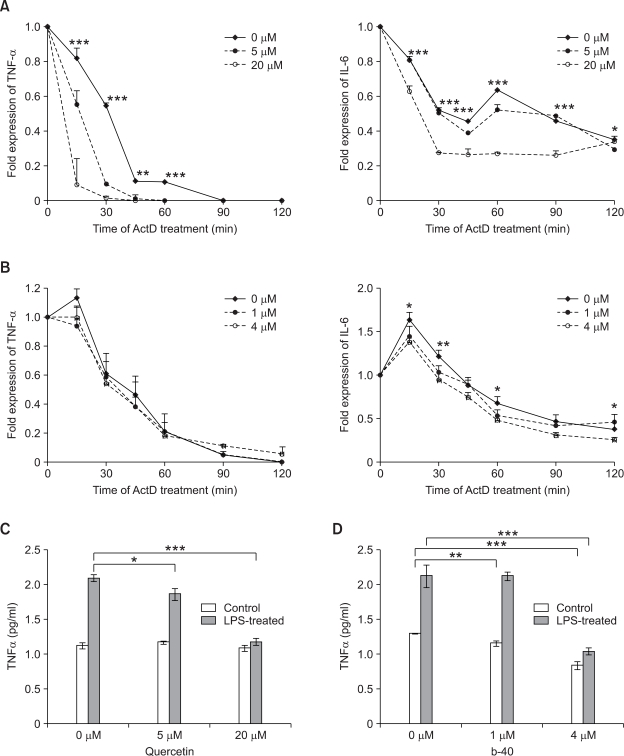
Figure 4.
Effect of quercetin and b-40 on TNF-α and IL-6 expression in LPS-treated RAW264.7 cells. RAW264.7 cells were pre-treated with 1 µg/ml LPS for 1 h and transcription was blocked using Actinomycin D (5 mg/ml) and quercetin (A) or b-40 (B). Total RNA was isolated at the time points indicated for quantification of TNF-α and IL-6 mRNA using semi-quantitative RT-PCR. Error bars present ± standard deviation (SD) of three independent experiments. Statistical analysis was performed by one way ANOVA (Tukey post-test) using Graph Pad Prism5 software. A P value of less than 0.05 was considered statistically significant (*P < 0.05, **P < 0.01, ***P < 0.001). Levels of secreted TNF-α and IL-6 proteins were measured using an ELISA kit after 24 h treatment with quercetin (C) or b-40 (D) in LPS-activated RAW264.7 cells. Data of (C) and (D) are shown as a mean ± SD (n = 3). Statistical analysis was performed by t-test using Graph Pad Prism5 software.

