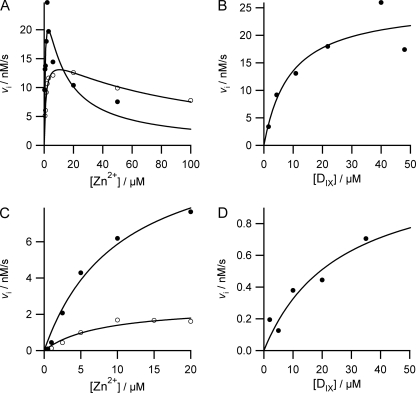
FIGURE 1.
Initial rates of zinc porphyrin formation catalyzed by 10 nm ferrochelatase. Assay conditions were 0.1 m Tris-HCl, pH 8.1, 0.5% Tween 20, without (A and B) or with (C and D) 0.5% cholate at 30 °C. A, zinc dependence of the initial rate of zinc chelation. Filled circles represent experimental points at 21.8 μm DIX, and the line is theoretical with characterizing parameters Vapp = 30.8 ± 8.0 nm s−1, Kmapp = 0.74 ± 0.45 μm, Kiapp = 10.0 ± 6.2 μm. Open circles represent experimental points at 4 μm DIX and a theoretical line with characterizing parameters Vapp = 16.2 ± 0.9 nm s−1, Kmapp = 1.2 ± 0.2 μm, Kiapp = 87.9 ± 15.6 μm. B, DIX dependence of initial rate at 1.5 μm zinc with experimental points fitted to a theoretical line with characterizing parameters Vapp = 25.7 ± 4.5 nm s−1 and Kmapp = 9.0 ± 5.3 μm. C, zinc dependence of initial rate in the presence of 0.5% cholate. Filled circles represent experimental points at 20 μm DIX and a theoretical line with characterizing parameters Vapp = 11.9 ± 1.7 nm s−1 and Kmapp = 10.3 ± 3.1 μm. Open circles represent experimental points at 5 μm DIX and a theoretical line with characterizing parameters Vapp = 2.5 ± 0.5 nm s−1 and Kmapp = 7.9 ± 4.0 μm. D, DIX dependence of initial rate at 1 μm zinc in the presence of 0.5% cholate, the theoretical line is described by the characterizing parameters Vapp = 1.2 ± 0.5 nm s−1 and Kmapp = 25.9 ± 20.0 μm.

