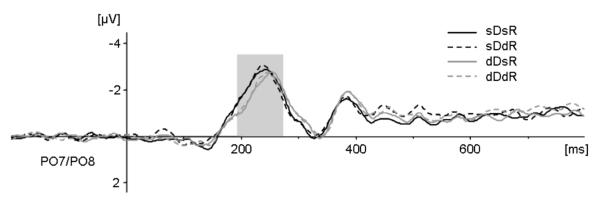
Figure 3B.
N2pc. Averaged difference waves (contralateral activity minus ipsilateral activity) of the N2pc component for each of the four experimental conditions at electrodes PO7/PO8. Dark grey lines indicate dimension repetitions, light grey lines indicate dimension changes in consecutive trials. Solid lines indicate response repetitions and dashed lines response changes. The analyzed time window ranged from 190 to 270 ms poststimulus.

