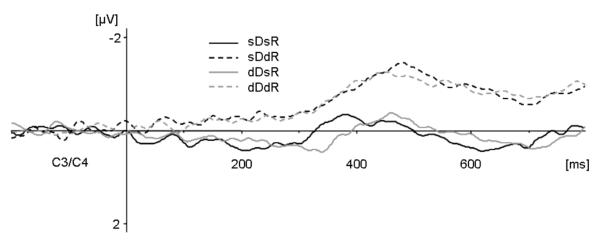
Figure 5.
Lateralized readiness potential. Stimulus-locked averages for each of the four experimental conditions at electrodes C3/C4 for the 800-ms post-stimulus time interval relative to a 200-ms pre-stimulus baseline. Solid lines indicate response repetitions and dashed lines indicate response changes. Dark grey lines indicate dimension repetitions and light grey lines indicate dimension changes in consecutive trials.

