
Figure 1.
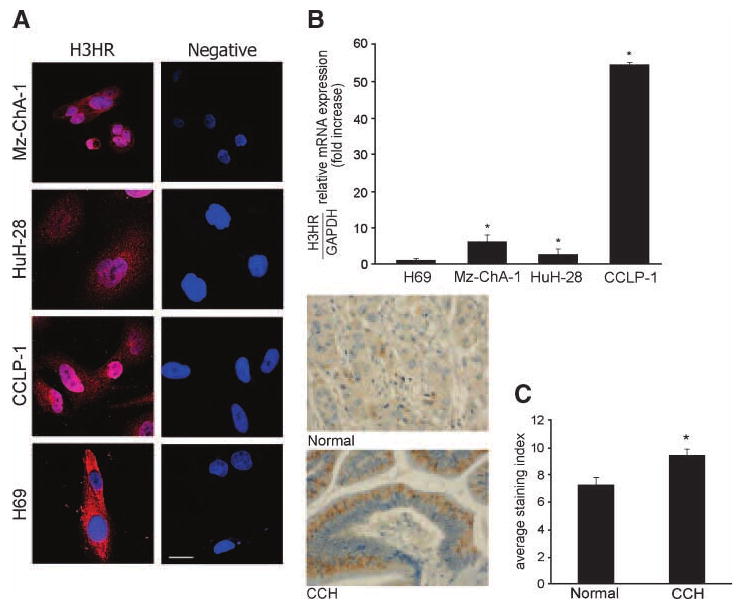
The expression of HRH3 was measured by immunofluorescence (A), real-time PCR (B), and tissue array analysis (C). A. By immunofluorescence, all the cholangiocarcinoma cell lines used as well as H69 expressed HRH3; specific immunoreactivity is shown in red, and the cell nuclei are counterstained with 4′,6-diamidino-2-phenylindole (blue). Bar, 50 μm. B. By real-time PCR, the HRH3 message was increased in cholangiocarcinoma cells compared with normal cells. Columns, mean of three experiments; bars, SEM. *, P < 0.05, versus HRH3 mRNA expression of H69 cells. C. HRH3 immunoreactivity was increased in cholangiocarcinoma samples compared with control. Original magnification, ×40. Columns, mean of three experiments; bars, SEM. *, P < 0.01, versus HRH3 expression of normal biopsy samples.