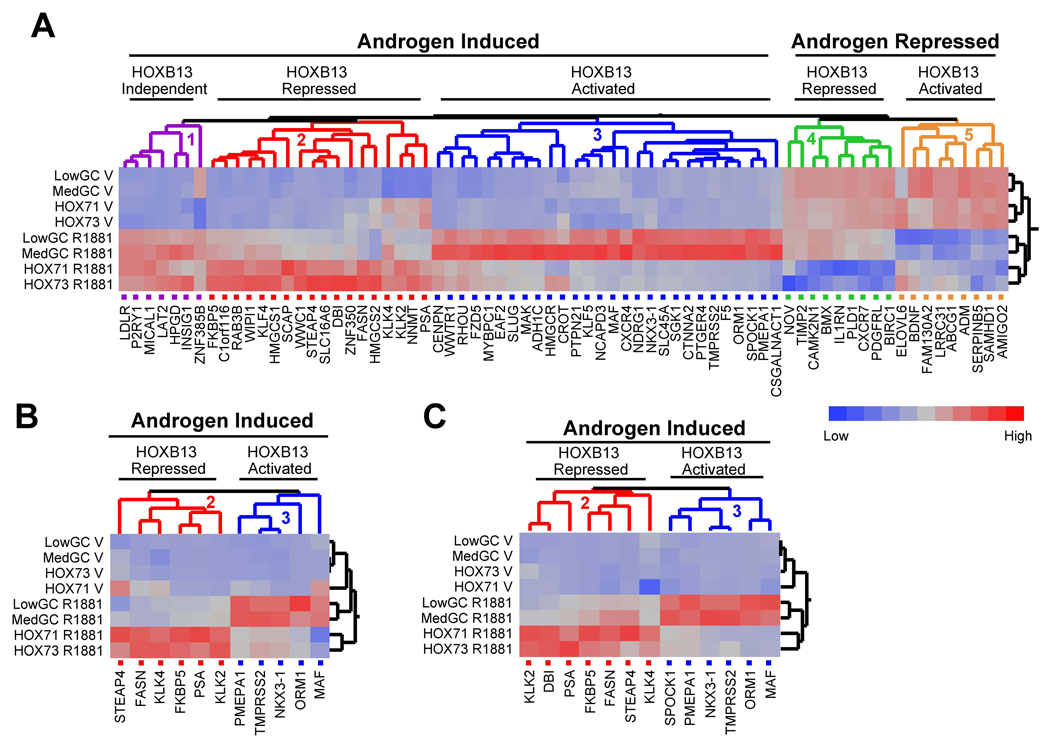
Figure 2. HOXB13 is a Key Regulator of Endogenous AR Target Gene Transcription.
(A) Dendogram showing expression profiles of endogenous AR target genes (AR gene signature) upon HOXB13 knockdown. Gene expression profiles of 53 genes induced and 13 genes repressed by R1881 treatment (100nM) were generated using LNCaP cells transfected with siRNAs for HOXB13 (HOX71, HOX73) and control (LowGC, MedGC). Following 24 h hormone treatment, RNA was harvested for cDNA production and real-time PCR analysis. The profiles were analyzed with the Ward hierarchical clustering algorithm using standardized data. V; vehicle.
(B) AR gene signature in LAPC4 cells. Experiment was performed same as in (A).
(C) AR gene signature in VCAP cells. Experiment was performed same as in (A).

