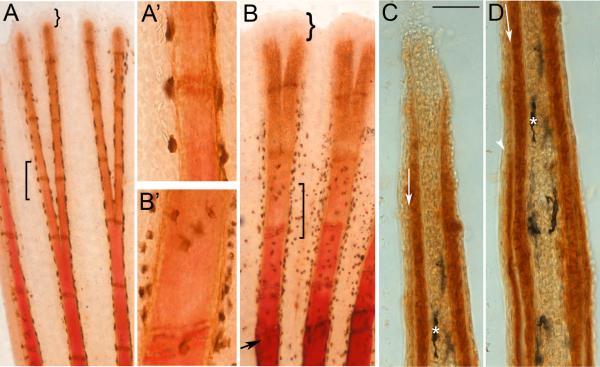
Figure 1.
Differences in the maturity of bone matrix can be detected using alizarin red. (A) Ontogenetic fin stained for both alizarin red and ZNS5. Square bracket identifies transition from the alizarin red positive staining (proximally) to the alizarin red negative region (A’ shows this in higher magnification). (B) Regenerating fin (5 dpa) stained for both alizarin red and ZNS5. Arrow points to amputation plane. Square bracket identifies transition from the alizarin red positive staining (proximally) to the alizarin red negative region (B’ shows this in higher magnification). Curved brackets in (A) and (B) identifies the ZNS5-negative region (the remainder of the fin ray is ZNS5-positive). (C) and (D) Sequential images of a single longitudinal cryosection through a ZNS5-stained fin ray (i.e. staining was completed on whole mount fins prior to sectioning). Arrow points to unstained bone matrix. Asterisk identifies a landmark melanocyte. Arrowhead in (D) points to ZNS5-positive signal on the lateral surface of the bone matrix (signal can also be observed medial to the bone matrix). Scale bar for C and D is 50 μm.

