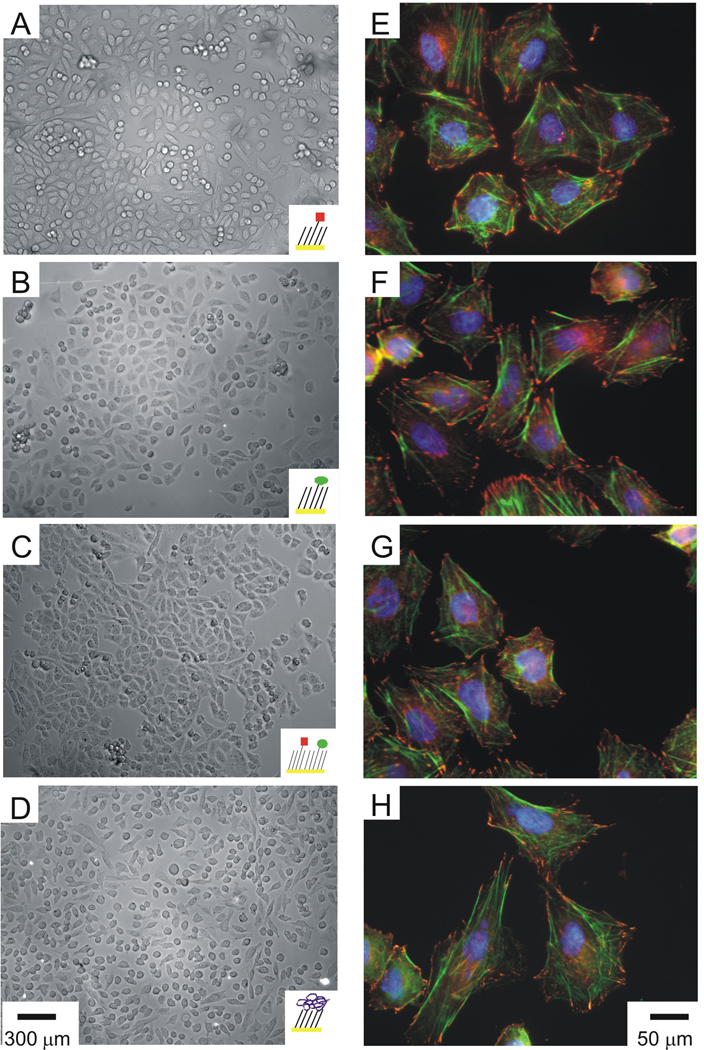
Figure 3.
αIIbβ3 CHO cell adhesion and cytoskeletal structure on model substrates. Optical micrographs of αIIbβ3 CHO cells incubated with [cRGDFG]=300 µM that adhered and spread on 0.5% SAMs presenting GRGDSC (A), HHLGGAKQAGDVC (B) and a mixed monolayer comprised of both peptides (C). As a control, αIIbβ3 CHO cells adhered and spread on a dodecanethiol monolayer with adsorbed Fbg (D). Scale bars are 300 µm. Immunofluorescence staining of αIIbβ3 CHO cells incubated with [cRGDFG]=300 µM that adhered and spread on 0.5% SAMs presenting GRGDSC (E), HHLGGAKQAGDVC (F), a mixed monolayer comprised of both peptides (G) and the Fbg control (H). Focal adhesions were visualized with an anti-vinculin antibody (red), actin stress fibers were visualized with AF 488 phalloidin (green), and nuclei were visualized with Hoescht (blue). Scale bars are 50 µm.

