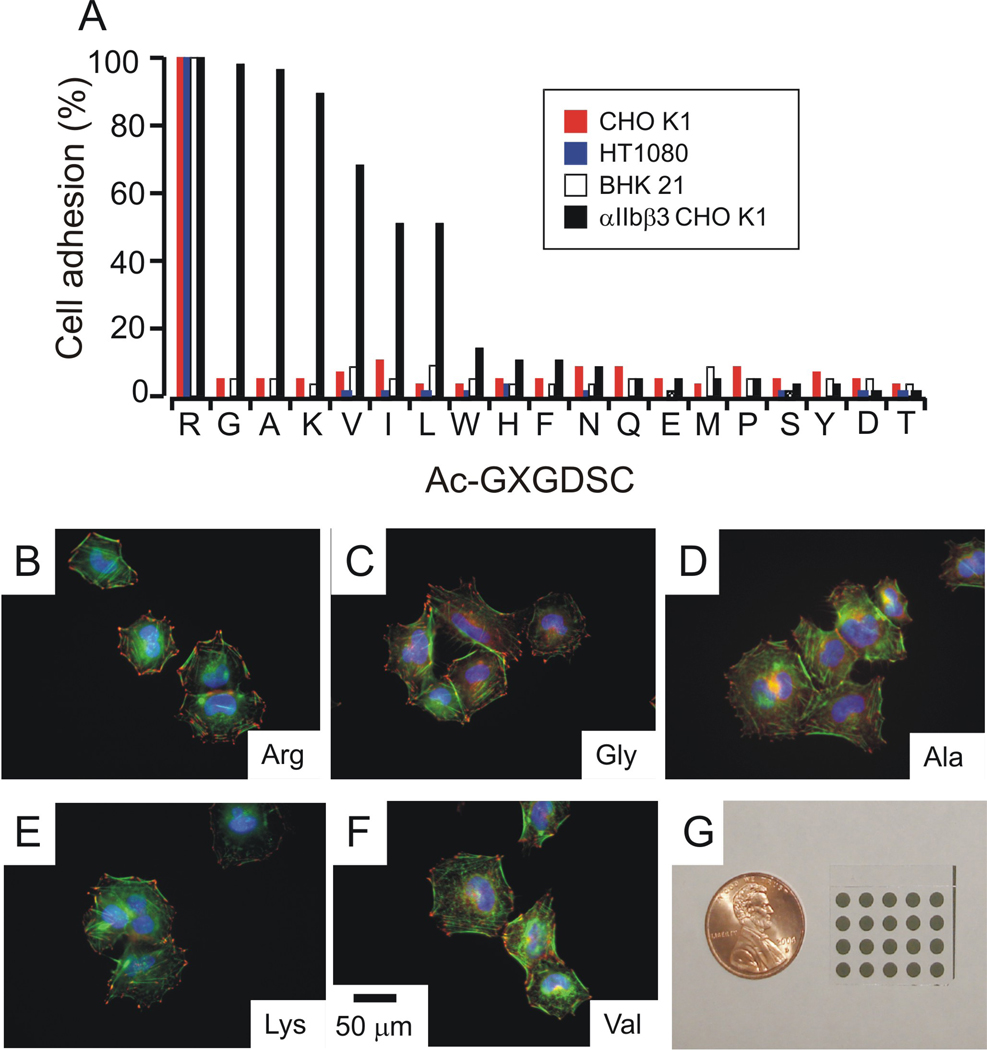
Figure 6.
Cell adhesion mediated by Ac-GXGDSC. (A) αIIbβ3 CHO K1 cells, CHO K1 cells, BHK 21 cells and HT 1080 cells were allowed to adhere to arrays of 0.5% GXGDSC . Cell adhesion was quantized as normalized units relative to adhesion in the 0.5% Ac-GRGDSC spot. Cells did not adhere to the spot presenting 0.5% GGRDGSC. Error bars are omitted for clarity. Immunostaining of peptides that mediated αIIbβ3 CHO K1 cell adhesion on the array. (B) 0.5% Ac-GRGDSC, (C) 0.5% Ac-GGGDSC, (D) 0.5% Ac-GAGDSC, (E) 0.5% Ac-GKGDSC, and (F) 0.5% Ac-GVGDSC. Focal adhesions were visualized with an anti-vinculin antibody (red), actin stress fibers were visualized with AF 488 phalloidin (green), and nuclei were visualized with Hoescht (blue).Scale bars are 50 µm. (G) 5X4 SAM array used for this work.

