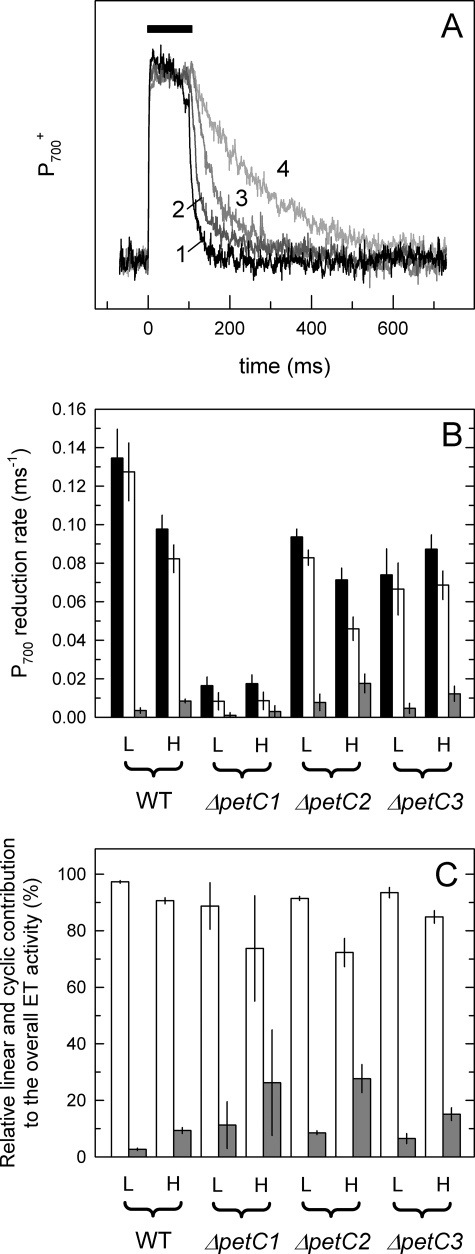
FIGURE 4.
Quantification of linear and cyclic electron transport by P700 redox kinetic measurements. A, kinetic traces of LL-adapted WT cells. The black rectangle symbolizes the time interval of the saturating light pulse (100 ms), which is followed by the reduction of P700+ (in the dark). The fastest kinetics observed in the untreated sample (curve 1), which is slowed down in the presence of MV (curve 2) and/or DCMU (curves 3 and 4) due to blocked cyclic and/or linear route(s), respectively. Curves correspond to three averaged traces of the same sample. Rate constants were determined by fitting. the curves with single exponential functions. Individual rate constants of linear and cyclic electron transfer (B) were determined as described under “Experimental Procedures” and in Ref. 51, and for comparison normalized to the overall electron transport activities (C). Black, white, and gray columns represent the determined overall, linear, and cyclic activities, respectively. Electron transport rates are averaged from measurements with three to five independent cultures. Activities of HL samples have been determined after 180 min of HL illumination.

