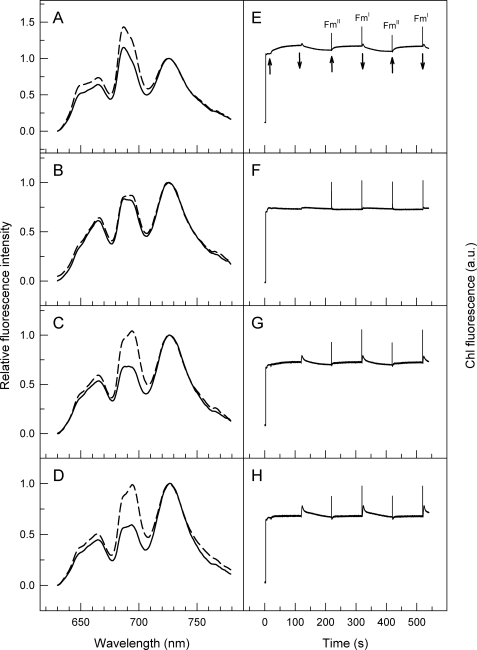
FIGURE 5.
State transitions followed by low temperature (77 K) fluorescence spectroscopy (A–D) or room temperature chlorophyll fluorescence (E – F) in WT (A and E), ΔpetC1 (B and F), ΔpetC2 (C and G), and ΔpetC3 (D and H) cells of Synechocystis PCC 6803. Left panels, excitation wavelength of 580 nm; solid and dashed curves represent two parallel samples that have been frozen after a 15-min dark incubation or after a subsequent FR illumination, respectively. All curves were normalized to the emission peak at 725 nm. Right panels, upward and downward arrows indicate “on” and “off” of FR illumination, respectively. Saturation pulses were given to record Fm in states I and II.

