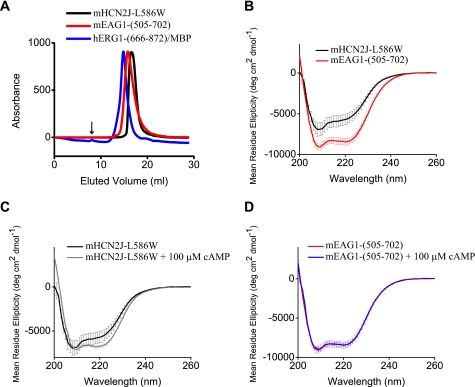
FIGURE 2.
Biochemical studies of the CNBD of the mHCN2, mEAG1, and hERG1 channels. A, size exclusion profiles of the isolated CNBD used in the study. Runs were performed on a Superdex 200 column. The void volume is indicated by the arrow. B–D, CD spectra of the isolated CNBD of the indicated channels in the far-ultraviolet region. 100 μm cAMP was added to the CNBD in C and D as indicated.

