FIGURE 3.
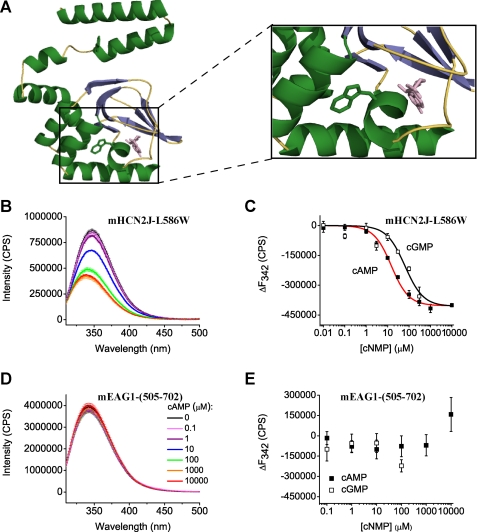
cAMP and cGMP decrease Trp fluorescence of mHCN2J-L586W and have no effect on the fluorescence of mEAG1-(505–702). A, ribbon representation of the homology model of mEAG1-(505–702) obtained with SWISS-MODEL (70) based on the crystal structure of mHCN2J (31). cAMP, colored in pink, is shown to illustrate a possible binding location as seen in the crystal structure of the CNBD of mHCN2 channels. Enlarged view of the cAMP binding pocket and the Trp residue are shown on the right. B and D, emission spectra of mHCN2J-L586W and mEAG1-(505–702) recorded without and with the indicated concentrations of cAMP. The excitation wavelength was 295 nm. Protein concentration was 4 μm. C and E, plots of change in the peak fluorescence intensity versus total cyclic nucleotide concentration for mHCN2J-L586W and mEAG1-(505–702). The change in the peak fluorescence intensity (ΔF) was calculated by subtracting averaged peak emission intensities for low cyclic nucleotide concentrations (intensities at 0, 0.01, and 0.1 μm cAMP at 342 nm) from the peak emission intensities. Data in C were fitted with Equation 4. The binding affinities were 13 ± 2 μm for cAMP and 62 ± 23 μm for cGMP for mHCN2J-L586W.

