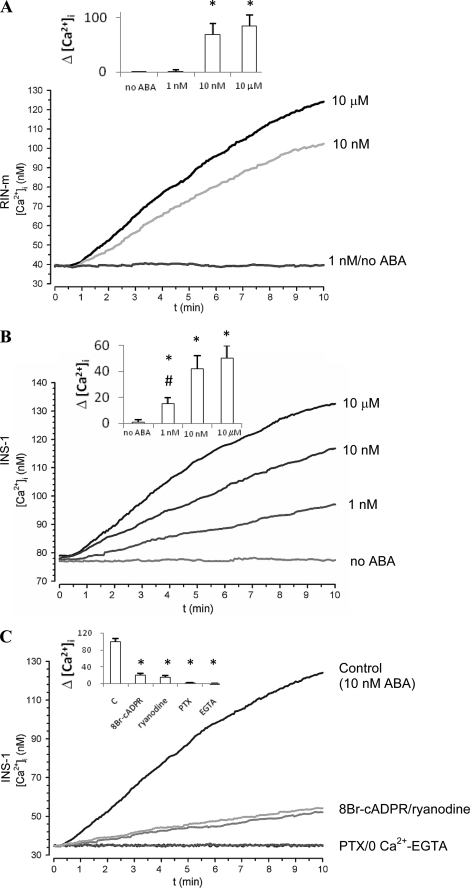
FIGURE 3.
ABA-induced [Ca2+]i increase in RIN-m and INS-1 cells. Fura2/AM-loaded RIN-m (A) and INS-1 (B) were treated with the indicated concentrations of ABA in HBSS (with Ca2+); insets to panels: difference between the [Ca2+]i values recorded at 10 min and at time = 0 (Δ[Ca2+]i) for each experimental condition. *, p < 0.05 by Tukey test, compared with the Δ[Ca2+]i without ABA; #, p < 0.05 by Tukey test, compared with the Δ[Ca2+]i with 10 nm and 10 μm ABA. C, Fura2/AM-loaded INS-1 were treated with 10 nm ABA in Ca2+ buffer (HBSS, control) or in Ca2+-free HBSS, containing 0.05 mm EGTA (0 Ca2+-EGTA), or preincubated for 30 min with 50 μm 8-Br-cADPR, 50 μm ryanodine, or 2 μg/ml PTX prior to ABA addition. Inset to C: Δ[Ca2+]i for each condition. *, p < 0.05 by Dunnett's method compared with Δ[Ca2+]i in the control. [Ca2+]i changes were measured at 20 °C, on microscopic fields containing ∼25 cells. A similar kinetics of the Ca2+ increase was observed on single cells (not shown). Representative traces from individual experiments are shown (n = 4). To verify trace stability, fluorescence signals were monitored for at least 5 min before ABA was added (at time = 10 s in all traces shown).

