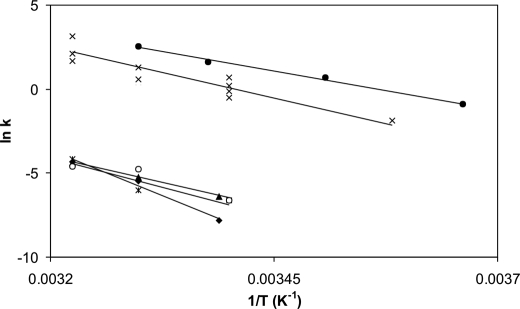
FIGURE 8.
Arrhenius plots of activation and inactivation processes of αCaMKII. Turnover rates were calculated from steady-state activity measurements (data set 1; ●); Thr286 autophosphorylation rates were estimated using data from a previous publication (26) where autonomous activity was used as a measure of Thr286 autophosphorylation (data set 2, ×); inactivation rates were obtained in EGTA (data set 3; ▴); and Ca2+ (data set 4; ♦) and Thr305/306 autophosphorylation rates were measured in EGTA (data set 5; *) and Ca2+ (data set 6; ○), as described above (also see Table 1).

