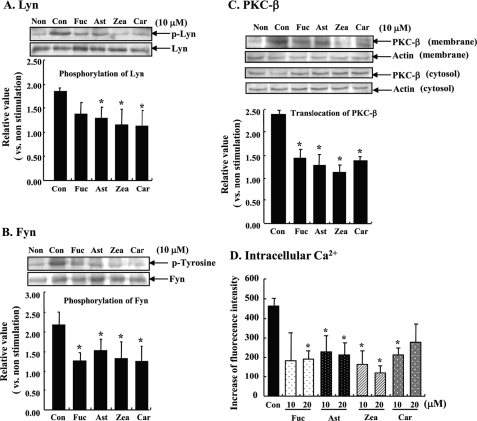
FIGURE 3.
Effect of carotenoids on the downstream of FcϵRI signal transduction. A and B, sensitized RBL-2H3 cells were incubated with each carotenoid for 4 h and stimulated with DNP-BSA for 5 min. Cell lysate was immunoprecipitated with Lyn- or Fyn-specific antibodies, and then phosphorylation of Lyn or Fyn was detected by Western blot analysis using phospho-Lyn (A) or phosphotyrosine antibody (B). Western blotting was performed independent three experiments. Data were analyzed by the density of bands and represented the intensity of the bands of phosphorylated Lyn/normal Lyn (A) and phosphorylated Fyn/normal Fyn (B), as a relative value for that of the nonstimulated cells. Means are represented by three different experiments. Values are mean ± S.D. C, cells were treated with each carotenoid for 4 h and stimulated with DNP-BSA for 20 min. Cell lysate was fractionated by centrifugation for 4 h at 20,400 × g (4 °C). Membrane and cytosolic PKC-β were detected by Western blotting using PKC-β-specific antibodies. Data were analyzed by the density of bands and represent the intensity of the bands of the membrane fraction/cytosol fraction as a relative value for that of the nonstimulated cells. Each fraction was corrected by β-actin before calculation. Means are represented by four different experiments. Values are mean ± S.D. D, IgE-sensitized cells were loaded with 4 μm Ca2+ indicator Fluo-4/AM after treatment with each carotenoid for 4 h and then the cells were stimulated with DNP-BSA for 90 s, and fluorescence was measured. Values are mean ± S.D., error bars represent the S.D., n = 6. *, significantly different from control, p < 0.05. The abbreviations are the same as those given in the legend to Fig. 1.

