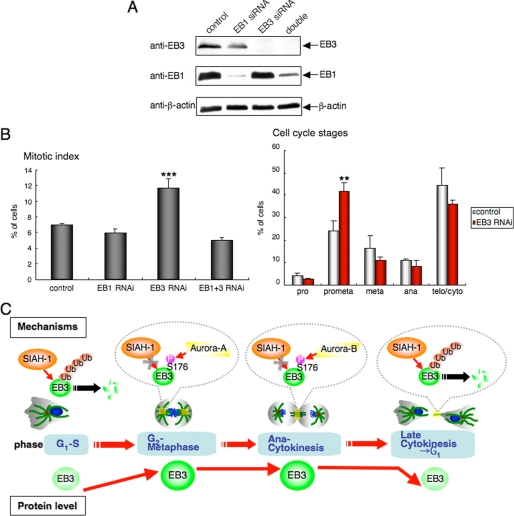
FIGURE 7.
Effects of EB3 knockdown on mitotic progression. A, knockdown of endogenous EB1 and/or EB3. HeLa cells were treated with siRNAs for EB1 and/or EB3 for 72 h, and then the cell lysates were subjected to Western blots with the indicated antibodies. One Western blot shown is representative of three independent experiments. B, left panel, quantitation of the mitotic index of HeLa cells treated with each siRNA after 72 h. The mitotic index is expressed as the percentage of the total population of cells in mitosis (n = 1000). Right panel, quantitation of the cell cycle stages of HeLa cells treated with control or EB3 siRNA after 72 h. Cell cycle stages were determined by scoring all mitotic cells by immunofluorescence for α-tubulin and chromosome staining (n = 1000). C, schematic representation of our results.

