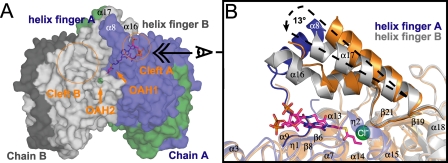
FIGURE 5.
Active site architecture. A, surface representation of the A-B dimer of GcdA facing the entangled helix fingers. The color code is in accordance to Fig. 4B. The orange circles indicate the position of the two active site clefts leading to OAH1 and OAH2. B, superposition of the crotonyl-CoAG·cdA and the apo-GcdA structure, displayed as a close-up view of the glutaconyl-CoA binding site at the A-B dimer interface. The corresponding chains of the apo-structure are displayed in orange. The broken lines illustrate the “movement” of helix α17 upon substrate binding.

