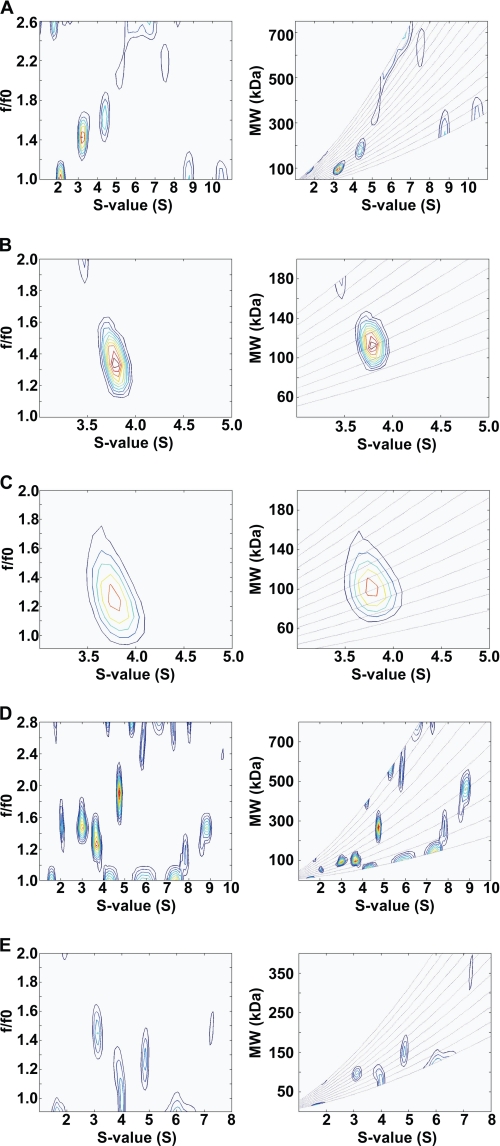
FIGURE 7.
Molar masses of PPCA, NEU1, and a complex of PPCA and NEU1. Velocity data for NEU1 at pH 5 (A), PPCA at pH 5 (B), the PPCA-NEU1 mixture at pH 5 (C), NEU1 at pH 7 and 1.8 mg/ml (D), and NEU1 at pH 7 and 0.45 mg/ml (E) were fitted to a two-dimensional size-and-shape distribution model, (c(s,f/f0)). Contour plots, frictional ratio versus sedimentation coefficient (left panels), and molecular weight versus sedimentation coefficient (lines represent constant f/f0 values) (right panels) were generated from the c(s,f/f0) analysis. The differently colored contours represent c(s,f/f0) values from 0.0 fringes/S (white) to maximum-value fringes/S (red), with increasing color temperature indicating higher values.

