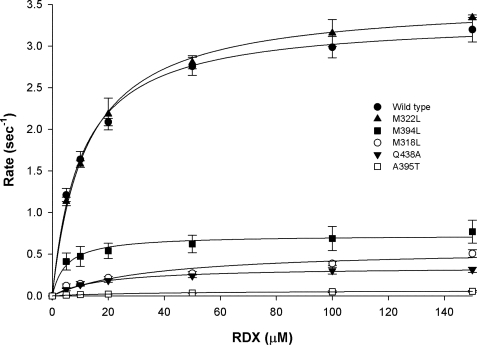
FIGURE 6.
Graph showing rate of RDX consumption as measured by kcat and determined by high-performance liquid chromatography versus concentration of RDX. Methionine-leucine mutants in position 322 displays catalytic behavior comparable to the wild type in this respect, but rates of RDX consumption were much reduced for both Gln-438 → Ala and Ala-395 → Thr mutants.

