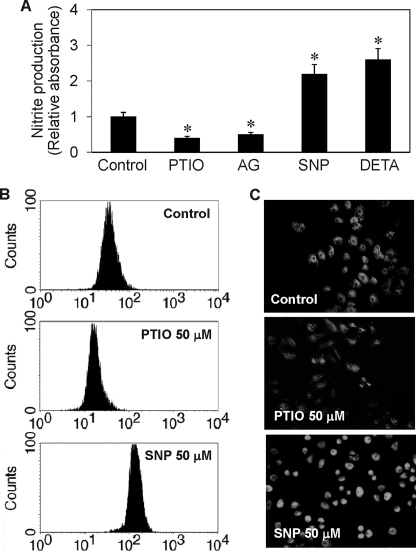
FIGURE 2.
Effect of NO modulators on cellular NO and nitrite levels. H460 cells were detached and either left untreated or treated with SNP (50 μm), DETA NONOate (50 μm), AG (300 μm), or PTIO (50 μm) for 2 h. A, nitrite production determined by the Griess assay. B and C, NO production determined by flow cytometry and fluorescence microscopy using DAF-DA as a probe. Data are the mean ± S.D. (n = 3). *, p < 0.05 versus non-treated control.

