FIGURE 4.
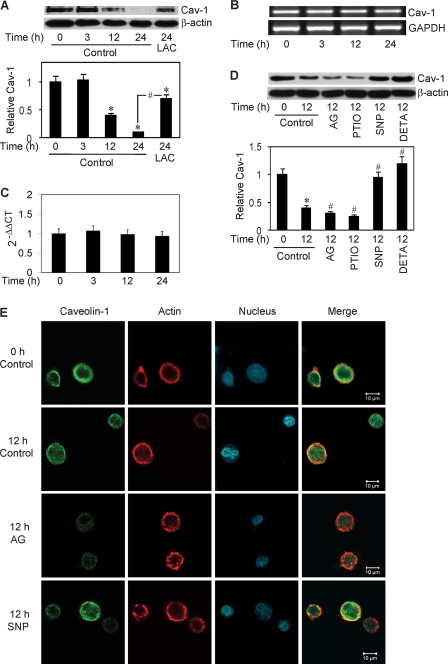
Effect of cell detachment on Cav-1 expression and its regulation by NO. A, H460 cells were detached and seeded in HEMA-coated plates for various times (0–24 h) in the presence or absence of lactacystin (LAC) (10 μm). Cells extracts were prepared and analyzed for Cav-1 protein expression by Western blotting. Blots were reprobed with β-actin antibody to confirm equal loading of samples. The immunoblot signals were quantified by densitometry, and mean data from independent experiments (one of which is shown here) were normalized to the results in control cells at 0 h. B, RT-PCR analysis of Cav-1 and glyceraldehyde-3-phosphate dehydrogenase (GAPDH) mRNA expression at various times (0–24 h) after cell detachment. C, relative Cav-1 mRNA expression determined by quantitative real-time PCR. The relative mRNA expression was determined by using the comparative CT method as described under “Materials and Methods.” D, detached cells were treated with NO inhibitor, AG (300 μm) or PTIO (50 μm), or with NO donor, SNP (50 μm), or DETA NONOate (50 μm) for 12 h, after which they were analyzed for Cav-1 expression by Western blotting. E, detached cells were either left untreated or treated with SNP (50 μm) or AG (300 μm) for 12 h and analyzed for Cav-1 by immunofluorescence confocal microscopy. Cells were also stained with Alexa Fluor 546-conjugated phalloidin and ToPro-3 to aid visualization of actin cytoskeleton and nucleus. Data are the mean ± S.D. (n = 3). *, p < 0.05 versus attached cell control; #, p < 0.05 versus the indicated control or 12-h detached cell control.

