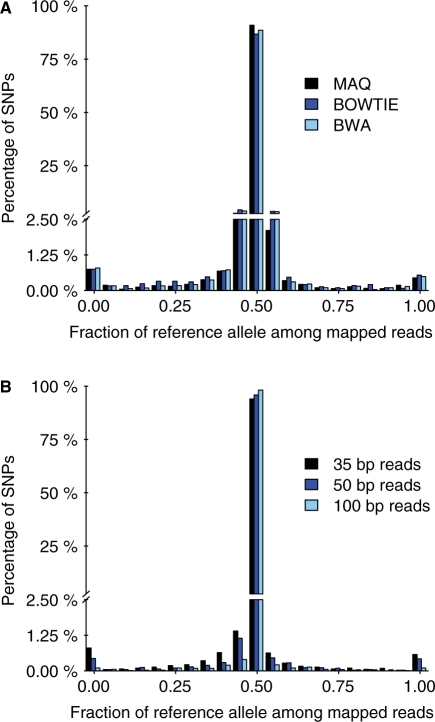
Fig. 4.
Bias for three short-read alignment programs and for three read lengths. (A) The plot shows the distribution of the fraction of mapped reads that carry the reference allele. Simulated reads with an error rate of 0.01 were mapped to the masked genome using MAQ (black), BOWTIE (dark blue) and BWA (light blue). Other details as in Figure 2B. (B) Mapped with MAQ as in (A) except that reads contained no additional errors and read lengths were as indicated.

