
Fig. 5.
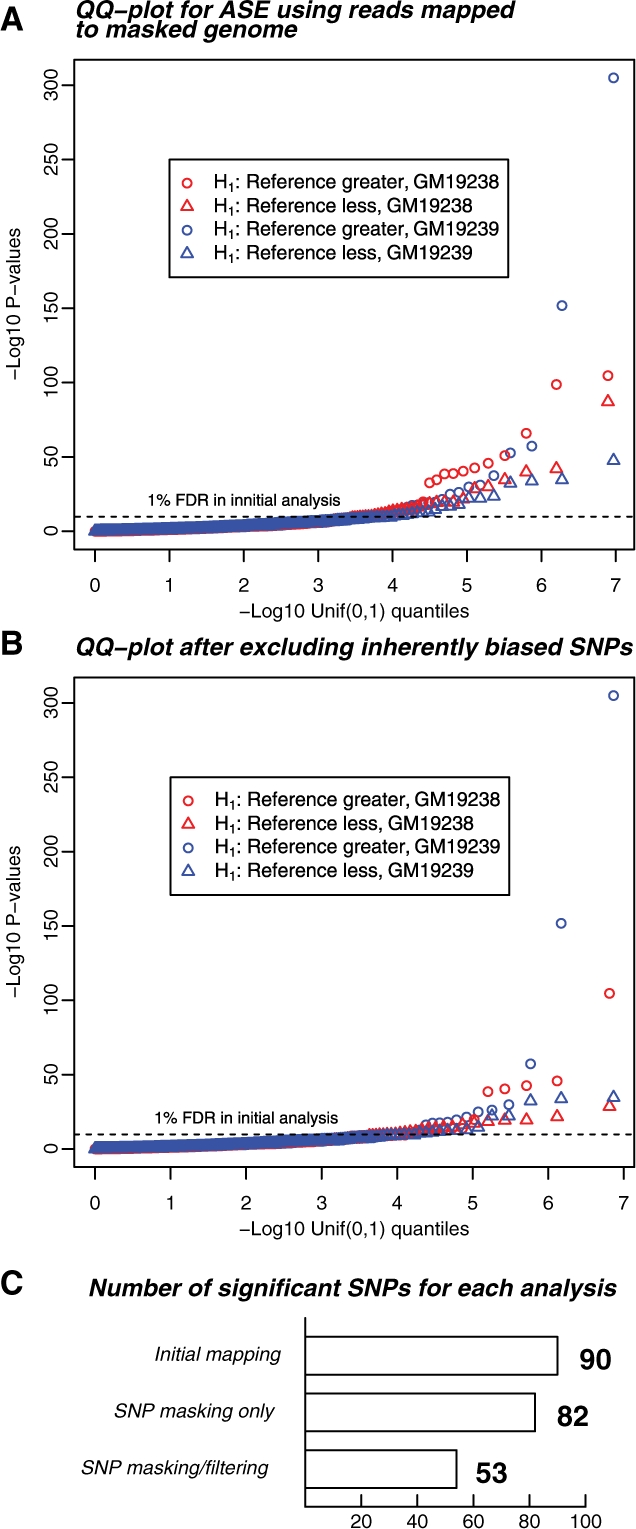
Summary of the ASE results after SNP masking, and after excluding inherently biased SNPs. (A) Distribution of ASE P-values after masking known SNP variation. Masking has largely eliminated bias toward the reference allele (circles: overrepresentation of reference allele; triangles, overrepresentation of non-reference allele), however, the number of significant results is not reduced. Display is as in Figure 1B. The horizontal dashed line represents the P-value threshold of 5.5 × 10⁻⁵ that allowed an FDR of 1% in the analysis presented in Figure 1. The FDR for this analysis using the initial P-value threshold was also 1%. (B) Distribution of P-values after excluding SNPs with an inherent bias toward one allele, as determined by simulations of perfect reads. This set of significant results is likely much more reflective of genes that show genuine ASE. The FDR for this analysis using the initial P-value threshold here was 1.4%. (C) Barplot showing the number of significant results for the three read-mapping strategies used in this article, corresponding to Figures 1B, 5A and 5B, using a P-value cutoff of 5.5 × 10⁻⁵, corresponding to FDRs of 1.0%, 1.0% and 1.4%, respectively.