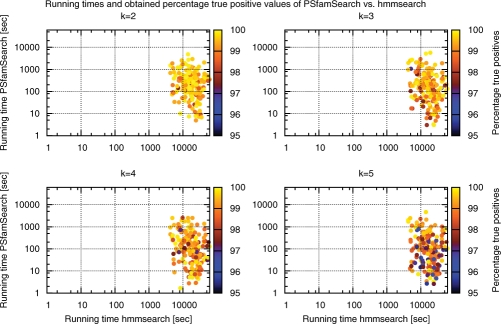
Fig. 5.
Comparison of running times (x- and y-axis) and achieved percentage true positive values (color coded) between PSfamSearch and hmmsearch, when searching with PSSM-FMs (pHMMs) representing the first 200 TIGRFAM families on UniProtKB/TrEMBL Rel. 40.3. Different values of k represent different training set sizes. For further details see text.

