Figure 3.
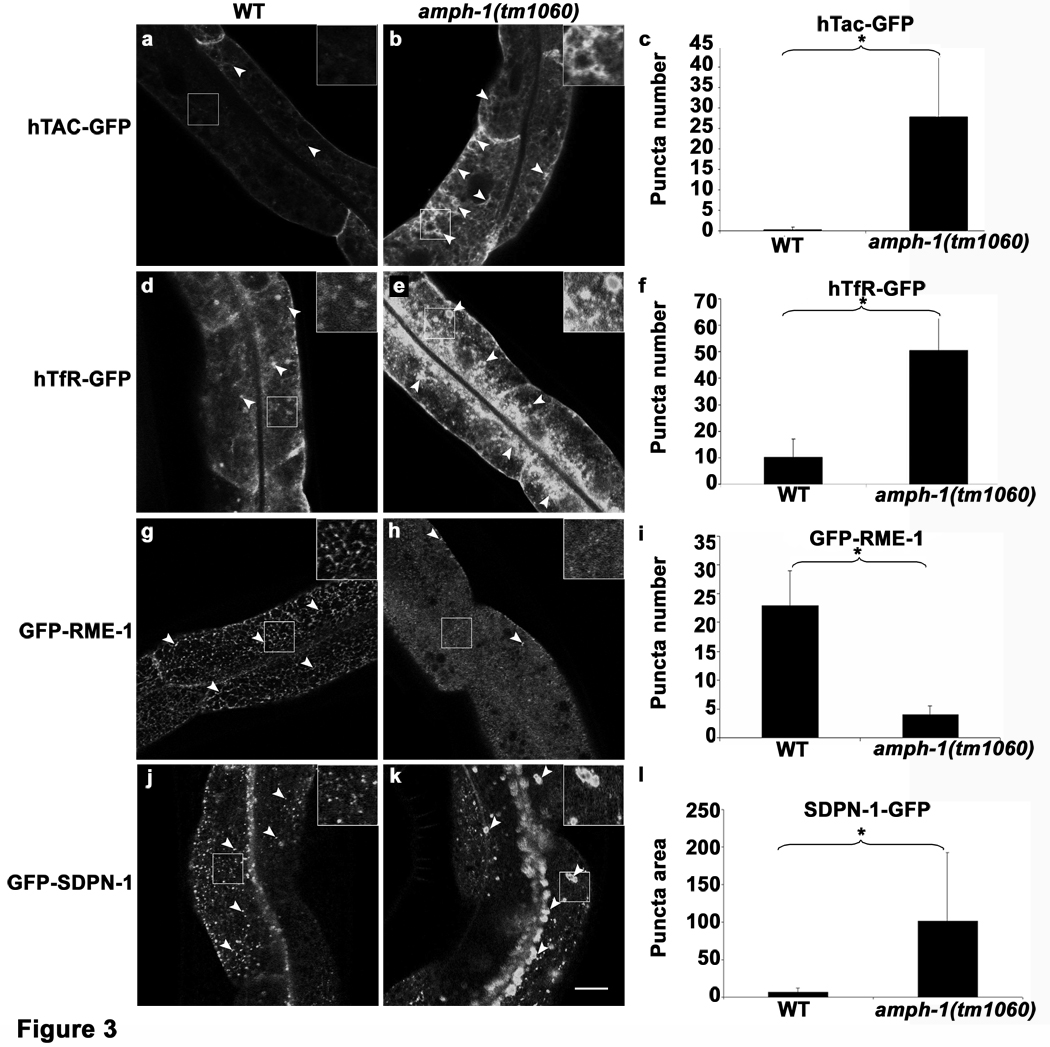
C. elegans amph-1 mutants display abnormal trafficking of recycling cargo and morphologically abnormal recycling endosomes.(a–c) hTAC-GFP, a cargo protein internalized independently of clathrin, accumulates intracellularly in amph-1 mutants. Arrowheads indicate punctate and tubular hTAC-GFP signal in the intestine. (c) Quantification of hTAC-GFP signal in the intestine of living wild-type and amph-1 mutant animals with respect to average number of labeled structures per unit area. The asterisk indicates a significant difference in the one-tailed Student’s T-test, p-value= 1.2×10⁻¹² (d–f) hTfR-GFP, a clathrin-dependent cargo protein, accumulates intracellularly in amph-1 mutants. (f) Quantification of hTfR-GFP signal in the intestine of living wild-type and amph-1 mutant animals with respect to average number of labeled structures per unit area. The asterisk indicates a significant difference in the one-tailed Student’s T-test, p value=9.7×10⁻²². (g–i) Loss of GFP-RME-1 labeling of basolateral recycling endosomes in the amph-1(tm1060) mutants. Arrowheads indicate GFP-RME-1 signal. (i) Quantification of GFP-RME-1 signal in the intestine of living wild-type and amph-1 mutant animals with respect to average number of labeled structures per unit area. The asterisk indicates a significant difference in the one-tailed Student’s T-test, p-value =1.1424×10−07. (j–l) SDPN-1-GFP labeled recycling endosomes are altered in the amph-1(tm1060) null mutant, appearing fewer and larger. Arrowheads indicate SDPN-1-GFP labeled structures. (l) Quantification of SDPN-1-GFP signal in the intestine of living wild-type and amph-1 mutant animals with respect to average number of labeled structures per unit area. The asterisk indicates a significant difference in the one-tailed Student’s T-test, p-value=2.4×10−06.
For all the presented data, mean values were plotted on the graph and error bars represent ± s.d. from the mean. In all the experiments, n = 30 sampled fields (six animals of each genotype sampled in five different regions of each intestine). Scale bar represents 10 µm.

