Figure 7.
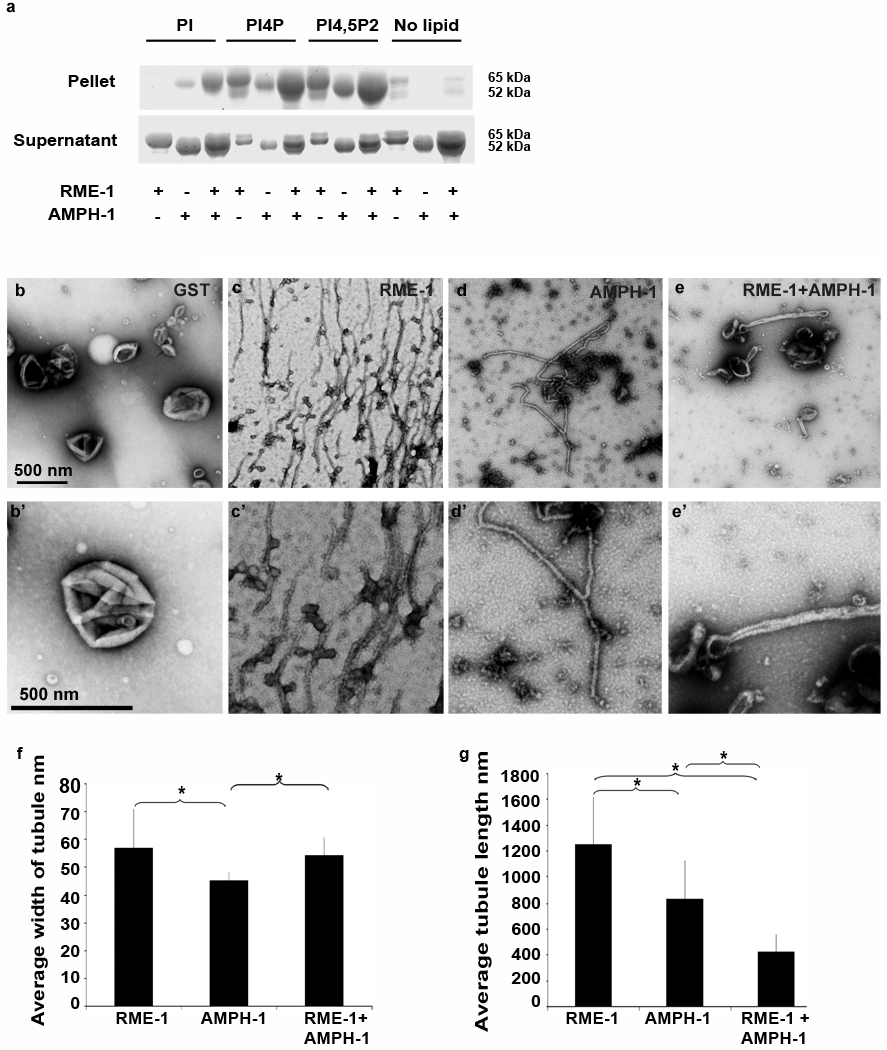
Membrane binding and tubulation by AMPH-1 and RME-1 in vitro with PI-[4,5]P2 liposomes. (a) Coomassie stained gels of supernatant and pellet fractions from liposome co-sedimentation assays are shown. Binding reactions were performed in the absence or presence of 0.33 mg/ml, 0.4 µm (average diameter) 80% Phosphatidylcholine (PtdChl), 10% Phosphatidylserine (PtdSer) and 10% of either unphosphorylated phosphatidylinositol (PI) or phosphatidylinositol-[4]-phosphate (PI-[4]-P) or phosphatidylinositol-[4,5]-bisphosphate (PI-[4, 5] P2) containing liposomes. Liposomes were incubated with 1mM ATP-γ-S and 1 µM of full length AMPH-1 or RME-1 proteins, or equimolar quantities of both proteins, as indicated. (b-e’) Electron micrographs of negatively stained PI-[4, 5]-P2 liposomes, prepared as above, but used at 0.05 mg/ml in the presence of 1mM ATP-γ-S with 2.5 µM proteins, GST (b-b’), RME-1-1 (c-c’), AMPH-1 (d-d’), or equimolar quantities of AMPH-1 and RME-1 (e-e’). Panels b–e represent 50, 000× magnification images while panels b’-e’ are enlarged regions from panels b–e respectively. (f) Quantification of tubule widths. For each experimental condition, width was measured for every tubule on each of 10 electron micrographs. For tubules demonstrating uneven width, an average measurement was made after taking measures at several representative points along the tubule. For n=10 representative tubules, the mean value for tubule width was plotted and error bars represent ± s.d. from the mean. The asterisk indicates a significant difference in the one-tailed Student’s T-test: RME-1 vs. AMPH-1, p value=0.01, RME-1 vs. RME-1+AMPH-1, p value= 0.29 and for AMPH-1 vs. RME-1+AMPH-1, p value= 0.004. (g) Quantification of tubule lengths. The length from the edge of the liposome body to end of tubule was measured for every tubule on each of 10 electron micrographs per experimental condition. For n=10 representative tubules for each experimental condition, the mean value of tubule length was plotted and error bars represent ± s.d. from the mean. The asterisk indicates a significant difference in the one-tailed Student’s T-test for tubule length: RME-1 vs. AMPH-1, p value= 0.005, RME-1 vs. RME-1+AMPH-1, p value=1.8 × 10−06 and for AMPH-1 vs. RME-1+AMPH-1, p value= 3.8 × 10−04.

