
Figure 2.
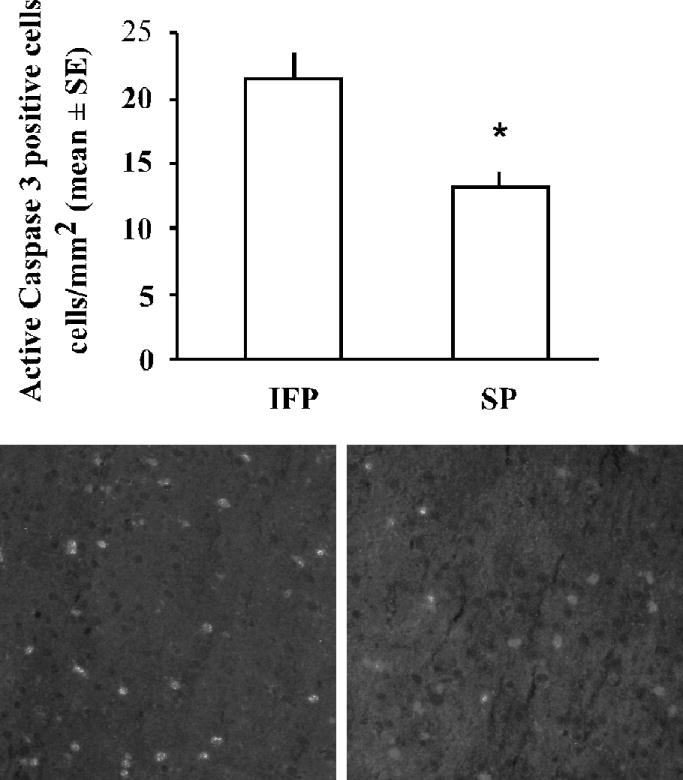
Active caspase-3 immunoreactivity in the ischemic cortex 22.5hr following tMCAO. Bars represent mean +/− SE of active caspase-3 positive cell/mm2 in three regions of the ischemic cortex from three sections per animal (n=5/group, *p< 0.05). Shown are representative images of active caspase-3 immunostaining in the ischemic cortex of IFP and SP rats.