
Figure 3.
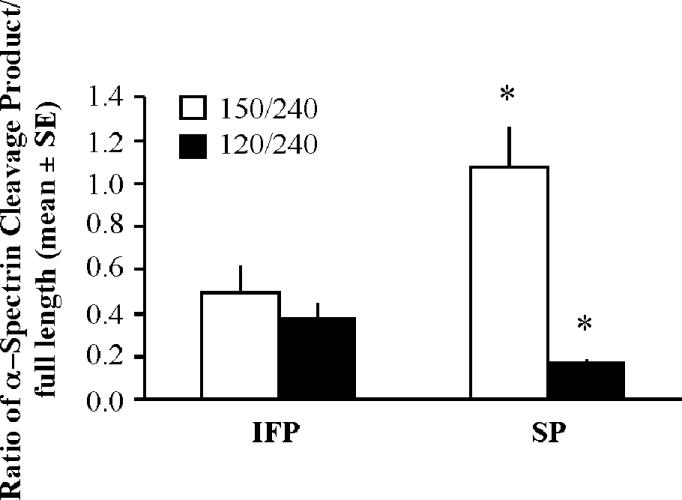
Spectrin cleavage in the ischemic cortex 22.5hr following tMCAO. Proteins were analyzed by western blotting to detect intact spectrin (240 kDa) and 120 kDa and 150 kDa spectrin breakdown products. Bars represent mean +/− SE of the ratio of spectrin-breakdown products to full-length spectrin normalized to β-actin from the same sample (n= 4–8/ group, *p< 0.05).