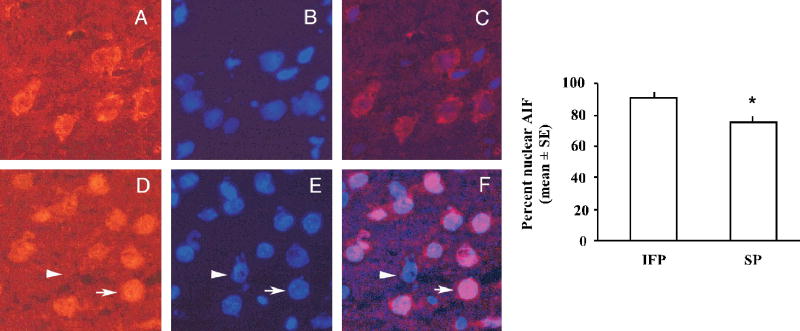
Figure 4.
Nuclear translocation of AIF in the ischemic cortex 22.5hr following tMCAO. Bars represent mean +/− SE of percent nuclear AIF localization in the ischemic cortex (n= 4/ group, *p< 0.05). Also shown are representative pictures of AIF immunostaining demonstrating both cytoplasmic (A) and nuclear (D) expression of AIF co-labeled with DAPI (B, E) for nuclear detection. Both cytoplasmic (C) and nuclear (F) AIF are visible in the overlayed images. The arrowhead shows a non-AIF expressing cell, while the arrow shows nuclear translocation of AIF.

