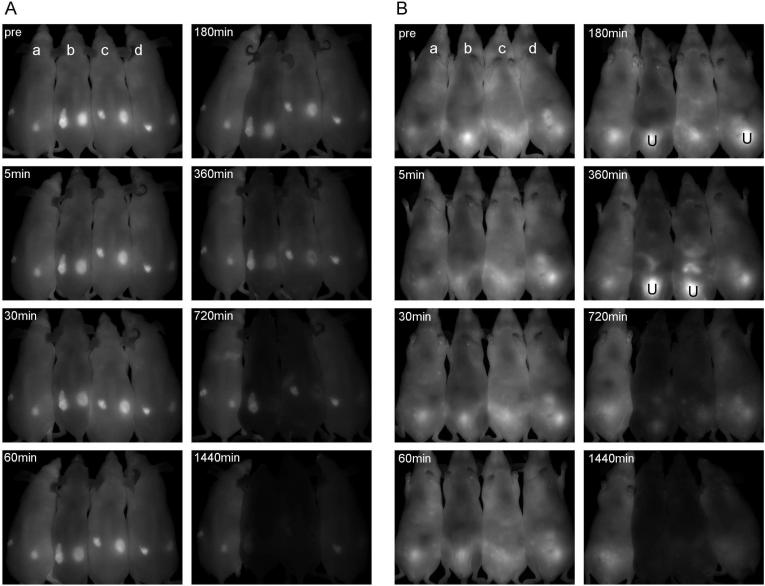
Figure 4.
Comparison of Alexa680 spectral images after b; nAv-QSY21 (250 □Êg, iv), c; neutravidin (250 □Êg, iv) or d; Av-QSY21 (250 □Êg, iv) injection into Tra-Alexa680-biotin treated mice at each time point. a; non-treated control. A; prone and B; supine images. Tra-Alexa680-biotin (50 □Êg, iv) was injected into tumor bearing mice (left dorsal; 3T3/HER2+, right dorsal; Balb/3T3/ZsGreen HER2- shown in A) one day before neutravidin treatments. The accumulation in the lower abdomen shown in B is the urine (U) in the bladder. 230×185mm (300 × 300 DPI)

